WK4DS Amateur Radio Blog
Search Posts
My 17 meter band pass filter and POTA…
Today I met up with some other hams that routinely go out together and activate POTA parks and was able to fellowship with them for a while before and after I made some contacts. There was (Jonathan Frye AA6H, Allen Padgett KN4FKS and Danny Wooten AG4DW) and they were running what appeared to be FT8 and SSB stations today. Allen and Jonathan were operating SSB the whole time and made quite a few contacts themselves. It was kind of neat to plug in the nanoVNA and see one of the other stations transmitting and messing with my antenna reading and when they stopped I could see the graph again! HAHA!
I built this band pass filter after having a couple of activations with my friend in Florida, Chas (NA2B). We were is such close proximity that if I didn’t have a bandpass filter for the band I was working, I simply couldn’t hear. The sBitx is notorious for front end overload and when the antennas are just a few yards apart, you are going to get front end overload! Well, on the bands that I had bandpass filters for, I had no issues, it was only the bands I lacked filters that I had a problem. It is pretty easy to find bandpass filters for the non-WARC bands, but WARC bandpass filters are kinda rare.
Well, I never let that stop me before…haha. A while back I went down the rabbit hole of wanting to make my own bandpass filters and I figured I would start with the 17 meter band since it is harder to find. I now own a spectrum analyzer with a tracking generator so I can sweep the filter in real time to see what tuning does to the filter shape. That is kinda awesome in its own right, but you could easily do the same thing with a nanoVNA too.

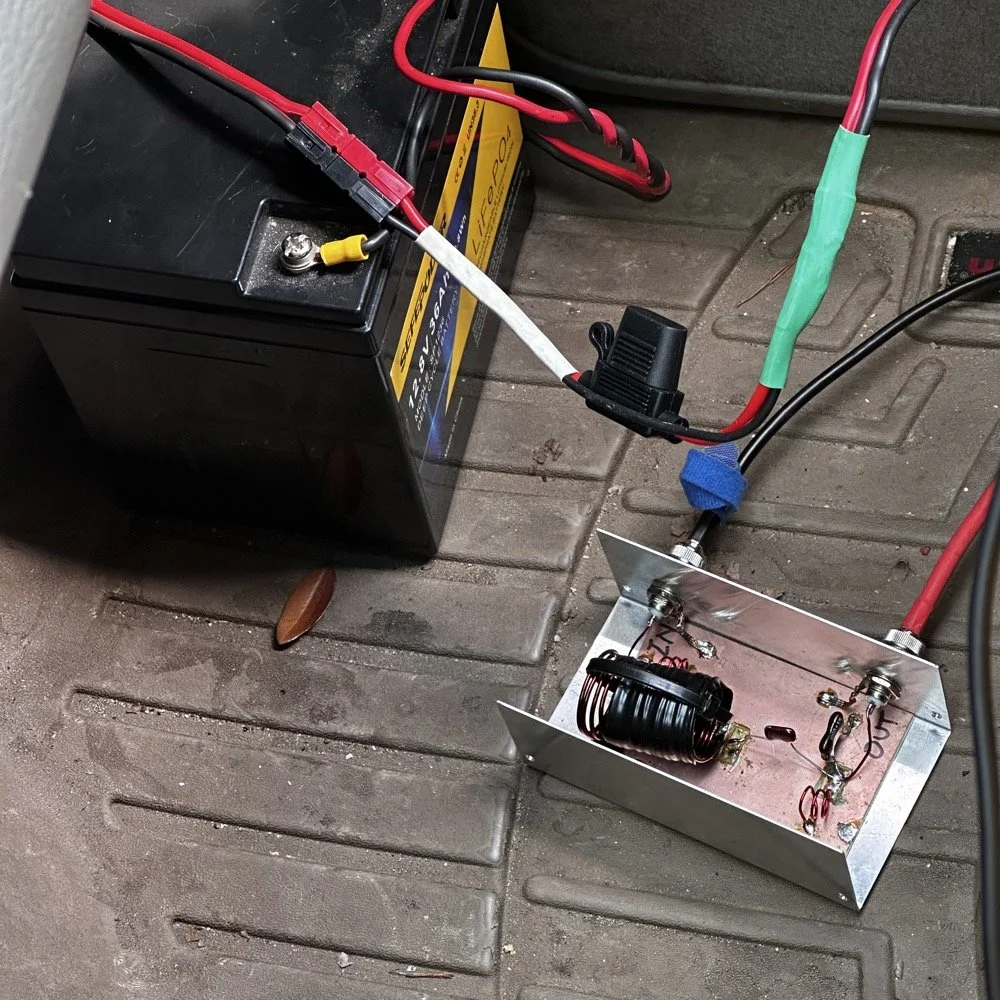
So here is the current iteration of the 17m bandpass module I built. IT sure looks like I home-brewed it, doesn’t it? HAHA! That big inductor It is a classic Pi design with an inductor and capacitor in parallel to ground at the front and back and a series inductor and capacitor in the middle. The input capacitor is underneath that massive 5.31uH inductor in the middle.. I taped it to keep the coils from moving around while I tuned it and then put the ziptie on it to hold the coils in place once I got it like I wanted it. I pulled the values for this filter from the internet off of one of the many website calculators that are out there…I don’t remember which one though… It has been a minute…haha.
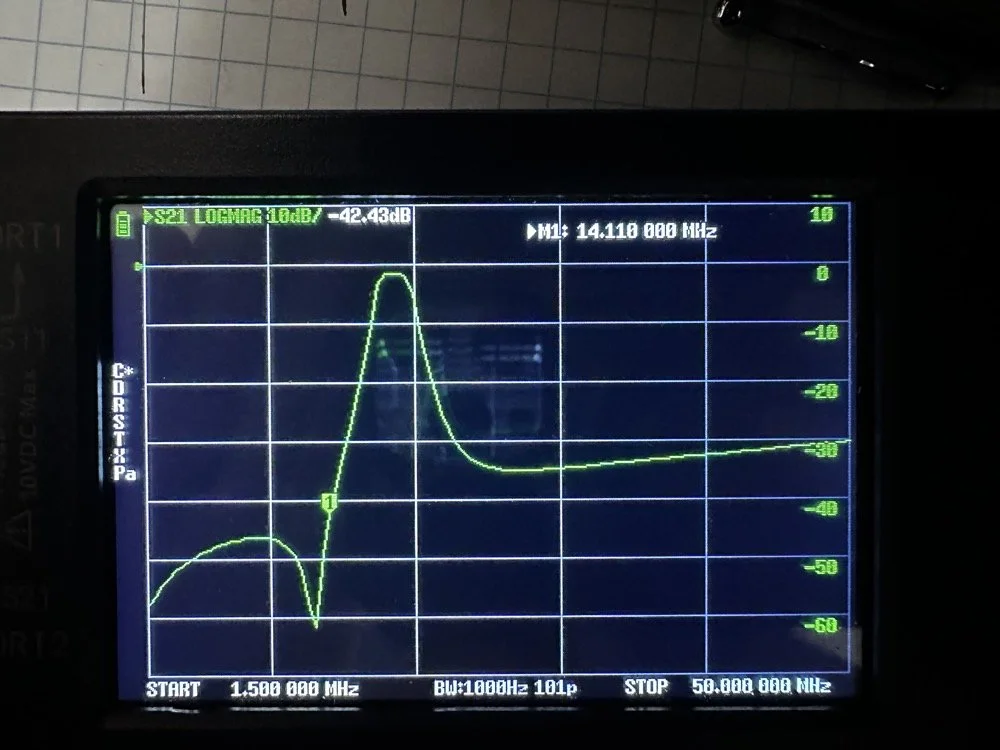
Adding this filter literally stopped all the 20 and 40 meter signals that I had from my neighbors today. It isn’t even all that great of a filter, it does have decent rolloff, but it isnt some knife edge vertical skirt filter. I grabbed a quick photo of the plot on my nanoVNA with the marker on the 20 meter band. I have a little more insertion loss (mine is 1.3dB as compared to a commercial unit at about .65dB), but it works almost as good as one that would cost 200$ and I have about 10$ in it. The filter was even better on the passband before I put it in the chassis. Since I used open air coils, they are interacting capacitivly with the aluminium body to ground. This added capacitance increased the passband insertion loss about .6dB, but it is so clean, I chose to just leave it as is and use it for now. The 20 meter band being over 40dB down compared to the 17 meter band, I was able to setup right next to Danny, who was on 20 meters at the time, without him coming into my radio at all from what I could tell. All the lower bands past 20 meters are lower than that too, so all of them are pushed out of the way so to speak. The higher bands are interesting to me. Before I mounted the unit in the aluminium chassis, it fell off on the high end too. Once mounted it looks like it is about 35dB on 10 meters and about 20dB on 15 meters, which is still good. Another problem that I encountered wtih the added capacitance is that it moved the passband up some. I had it to where the high side of the passband was right at the end of the 17m band before I mounted it. This gave me more attenuation on 15 meters, by probably 6dB or so, but you use what you have and move on with life… This would have also raised the 20 meter rejection some as well, by probably about 6dB or so.
This band pass filter project looks really simple.. The aluminum box, the two BNC connectors, some 16ga magnet wire, three capacitors and a piece of pc board material for a build plane and I am good to go. I lost the lid to the aluminum box hence no cover, but it appears to work just fine like this so I used it. It turns out that if you use toroid inductor cores, that this is a lot easeier to build as the toroids are LESS affected by the chassis ground plane. Notice I said less… they will still change values, just not as much as air wound inductors like I used here. I deliberately chose air wound inductors due to their high Q, which is what gives me the sharpness to the skirts you see in the plot below. I have it marked with “IN” and “OUT” but I honestly think it doesn’t matter which way it is inserted into the feedline as long as it is there. Another benefit of adding a passband filter is that is works both ways, it keeps out stray signals from strong nearby sources and it also only lets the part of your signal LEAVE that will fit through the passband. This makes a huge difference in your signal purity as you are adding a filter to the output of your radio.
Today I met up with some other hams that routinely go out together and activate POTA parks and was able to fellowship with them for a while before and after I made some contacts. There was (Jonathan Frye AA6H, Allen Padgett KN4FKS and Danny Wooten AG4DW) and they were running what appeared to be FT8 and SSB stations today. Allen and Jonathan were operating SSB the whole time and made quite a few contacts themselves. It was kind of neat to plug in the nanoVNA and see one of the other stations transmitting and messing with my antenna reading and when they stopped I could see the graph again! HAHA!
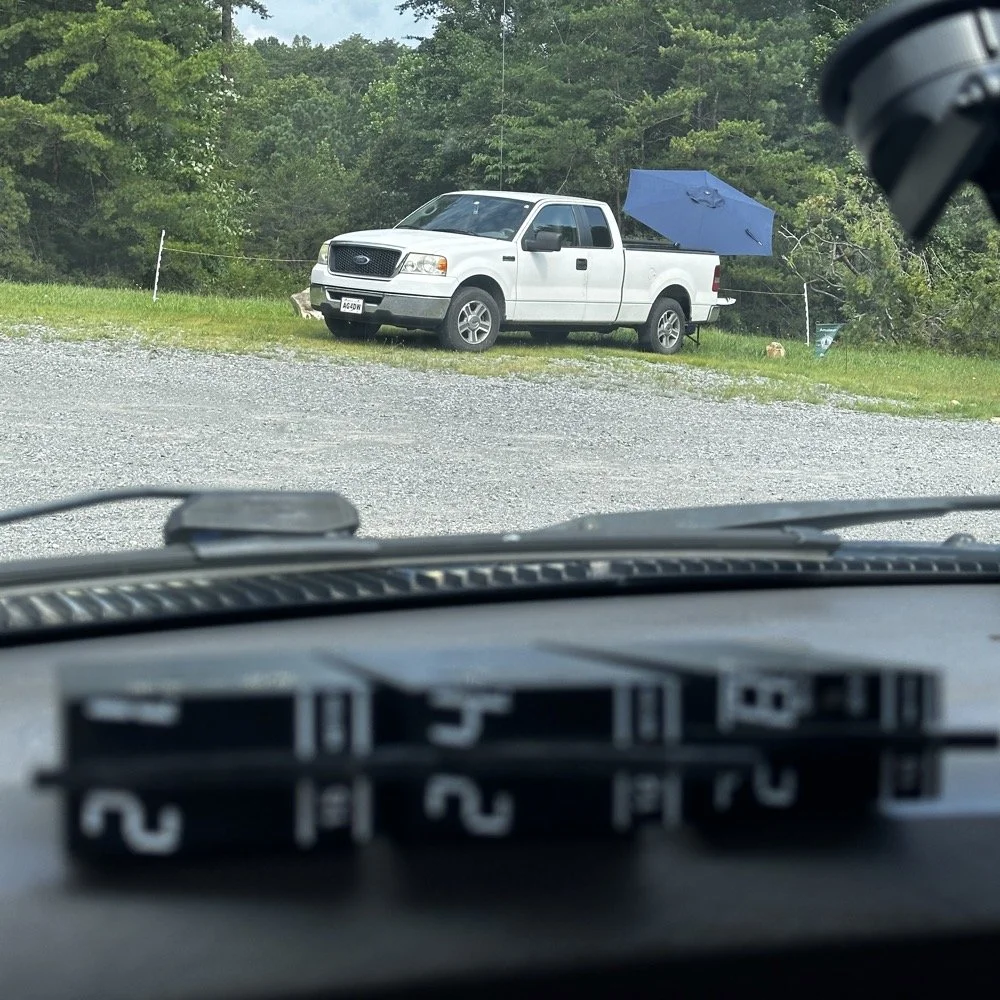
You can see the antenna right behind Danny’s (AG4DW) truck looking out the windshield of my truck today and I moved as far away from the other people as I could muster without driving in the yard… This area is really small to be fair. It just doesnt have a lot of room to setup too many stations. In reality I was probaby the last one that could fit without too much trouble being caused by other radios. Now that doesnt mean this park is overloaded with three stations. Not at all! There are 5 other locations to set up radios that I can think of right off hand with out even trying hard so we could setup several sites at this park very easily. Now, that turns it into something else thoguh, that might be enough activity to trigger the need for a permitted activity, but I dont know. I normally just hand out wtih these guys or go by myself for the most part so it is pretty low key like that.
Those band modules in the above photo are a precursor to what I did today. I opted to stay on the higher bands no matter what. I knew I could land the activation with FT8 and CW, but I had no idea just how hard it would be…haha. This poses a good challenge though as I know I can easily land the minimum ten QSOs to get the activation if I just start on 20 meters but lately the bands have been up and down and have been real inconsistent on the higher bands so to get my ten would take a bit more work on my part. Challenge accepted!
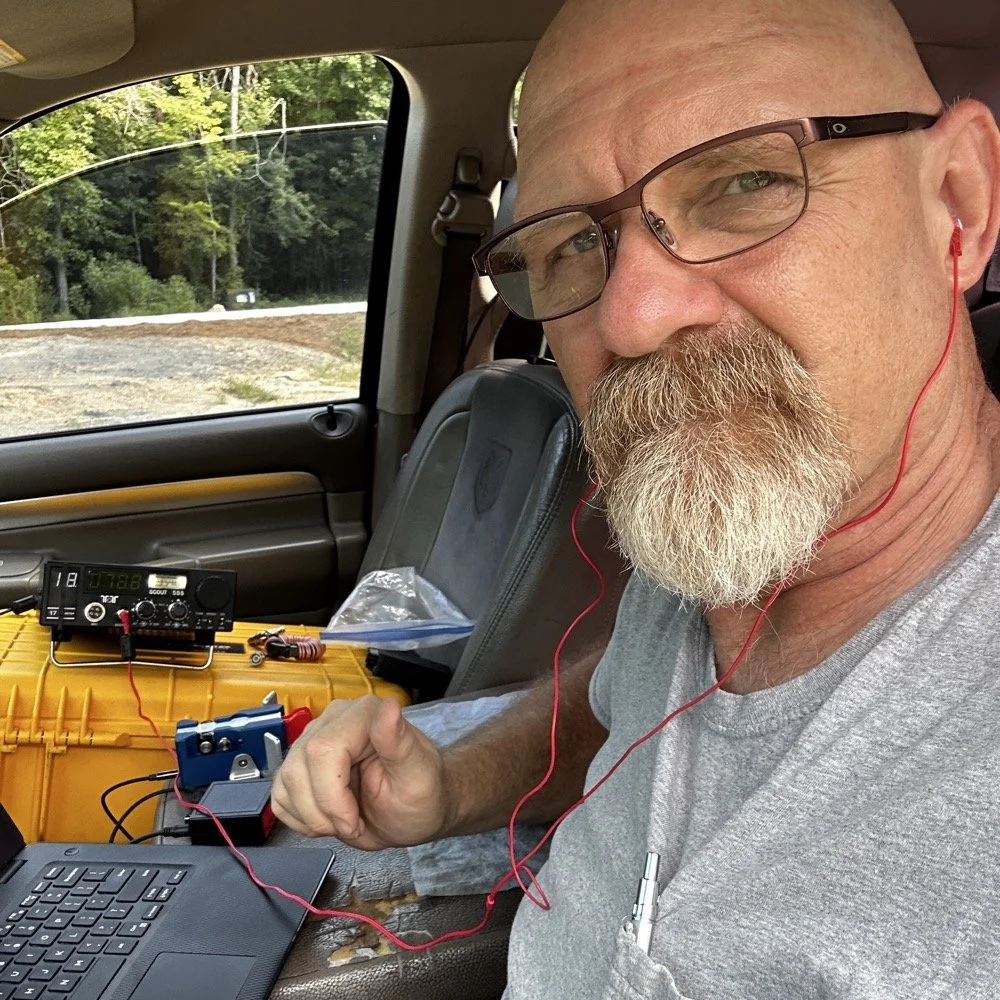
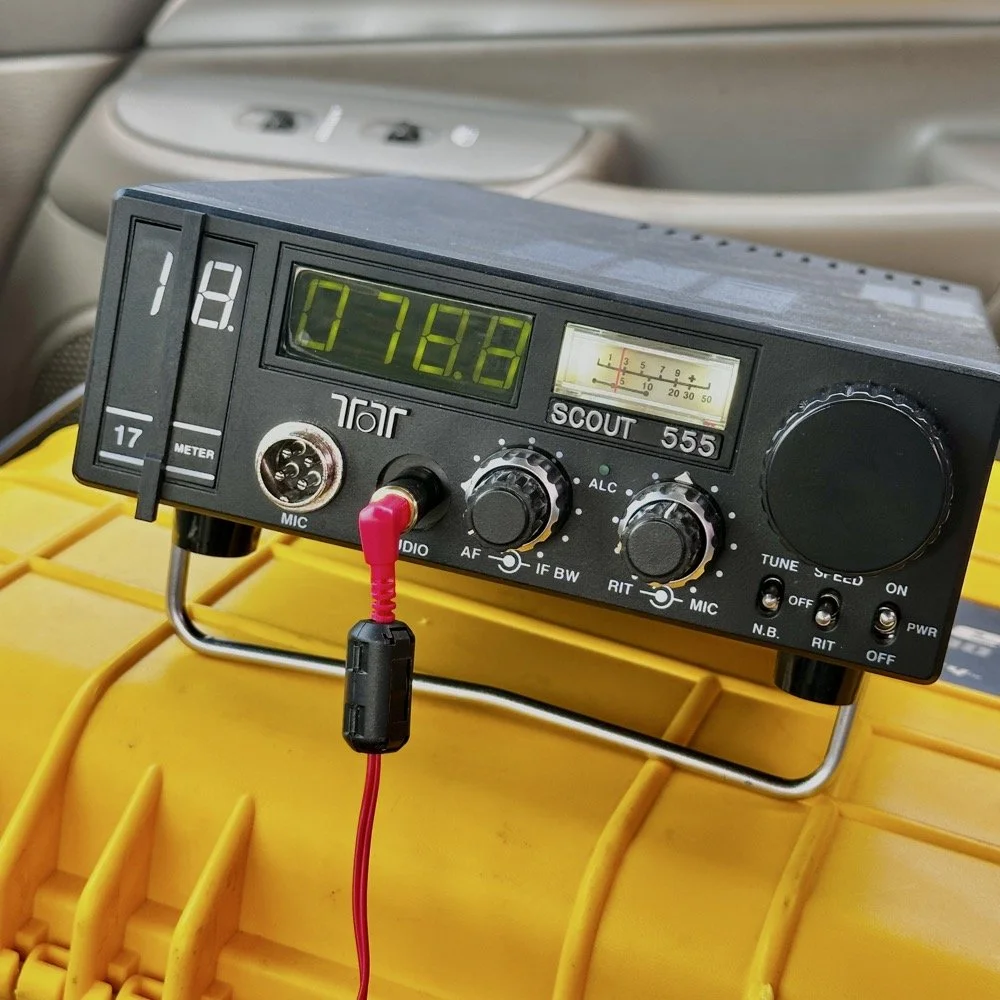
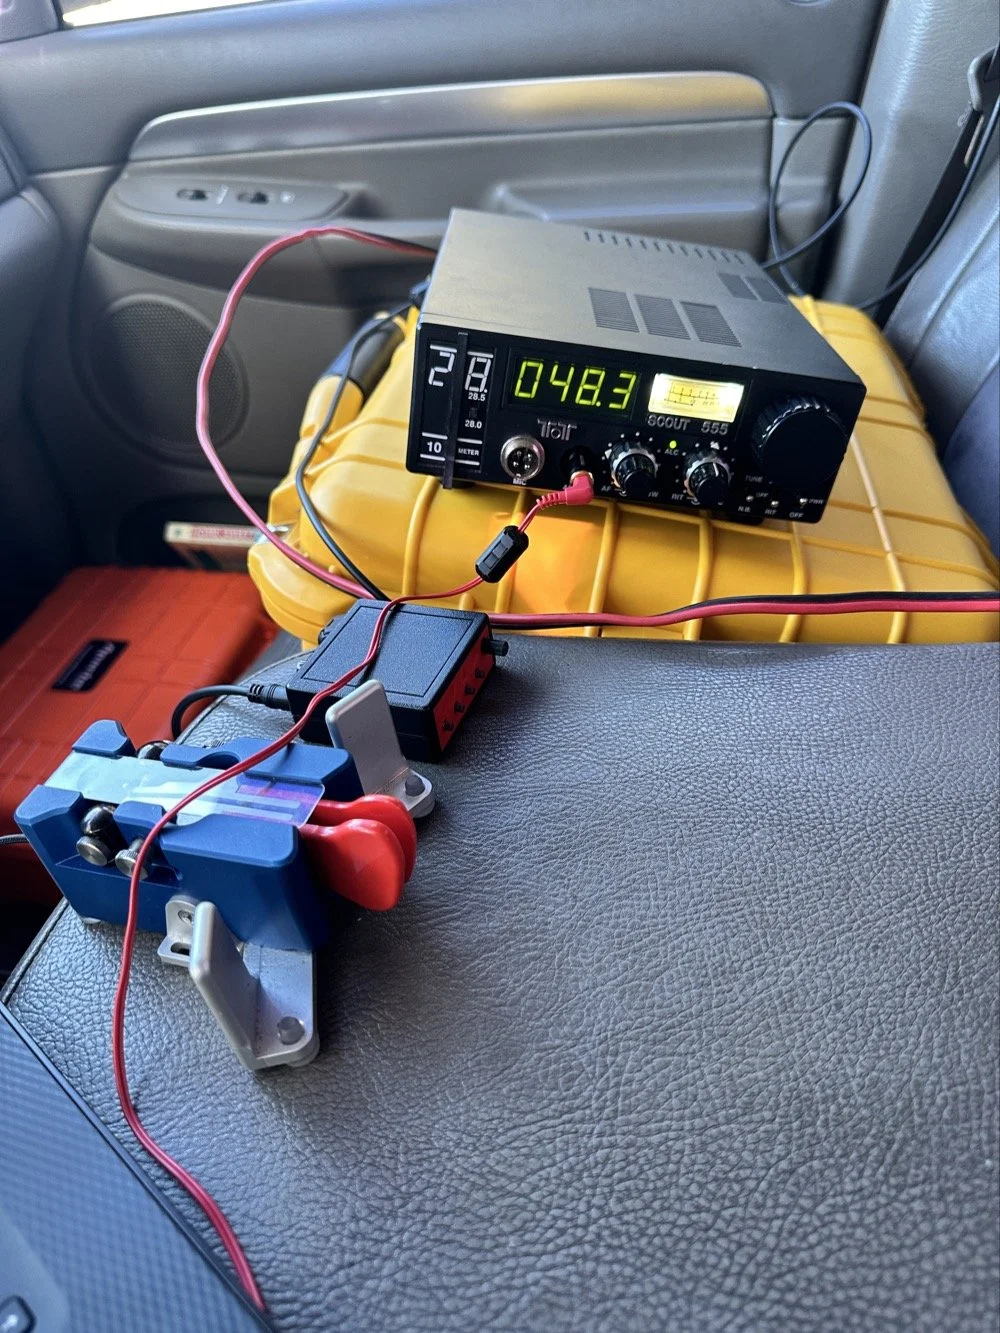
So, natuarally I started on 17 meters…haha. I actually planned to work my way up to ten meters, hence all those band modules you saw earlier. I found W1AW operating CW on 17 meters and busted his pileup to get in their log! That was my first QSO of the day too, I knew right then that it was going to be a good day. As you can see in the photo above, the station was setup in the truck cab to keep me out of the sun as much as possible. I also was using the Begali Traveler key and the HamGadgets Pico keyer as well. Also if you will notice, I dont have the common mode choke installed today. I was testing to see if getting the SWR below 2:1 made using it irrelevant or not. I had really good SWR all day at the radio so I dont think I need this thing adding losses to the system when I was having a good showing on the radio. (It is the thing laying next to the radio in the background.) Do you use one every time you go out or is it something you dont worry too much about? I ran this one through the nanoVNA and it said it had from -.06dB to -.19dB of loss just inserting it in the line. Look at the chart below to see what it looked like across the HF bands for this common mode choke on the nanoVNA.
160m: -.06dB
80m: -.09dB
60m: -.10dB
40m: -.12dB
30m: -.13dB
20m: -.15dB
17m: -.16dB
15m: -.16dB
12m: -.17dB
10m: -.19dB
While this might not sound like much loss (all of them being less than 2/10ths of a single dB), if the bands are in bad shape and you are trying to hear stations near the noise floor, this can make a difference. I routinely listen along the noise floor with headphones for stations that are really weak. Today was one of those days. The bands were really bad for the most part. CW was not being used much because of this. I did get a good run on FT8 on 17 and then 15 meters, but the CW portions were all in the tank.
I started on 17 meters as mentioned earlier, I started by hunting a little and found W1AW was making contacts so I worked them first thing. It only took me three or four trys to get them in the log so I was pretty stoked about the day at that. But then it took me 50 minutes to land the 5th QSO in the log! That is super slow for my normal operations. So I opted to switch to FT8 so I could get the activation locked in before I went off on the higher bands playing…
I worked five FT8 contacts in a little under 20 minutes just using hunt and pounce. This had my ten in the log so now the rest are “gravy” at this point. Next thing I did was re-tune the antenna to 15 meters and since the sBitx was already running, I hunted on FT8 there for a while. I netted 6 QSOs in something like 14 minutes. This is actually a pretty good rate for me on this radio so I was happy with that. After landing those in the log, I set the Scout 555 back up and called CQ on 15m CW for a while… I had zero replies… It was like the CW portion was simply turned off. Seriously, where did all the CW ops go? FT8 was booming! I saw a ton of DX on FT8, even though I couldn’t work them, but they were there. Anyway, after calling CQ for like 15 minutes with no replies I figured I would hop on 10 meters and listen for my beacon and then see if I could get at least one QSO there before calling it quits for the day.
It took me about 50 minutes of calling CQ into the void to finally land a contact between 15 and 10 meters. The last FT8 QSO in the log and the one on 10 meters CW are literally 50 minutes apart! That is a lot of calling CQ with no responses. I actually was listening to the radio while talking to Jonathan and just letting the keyer do its thing. When suddenly there was a reply out of the ether! KE2FUA up in New York heard my pitiful pleas for a call and felt sorry for me. Giving me the QSO on 10 meters I desperately wanted. With that in the log, I called QRT and broke down the station. Afterwards I was able to spend some time with the other operators on site and chat with them a little. This is the main reason I love activating with these guys, the camaraderie is incredible.
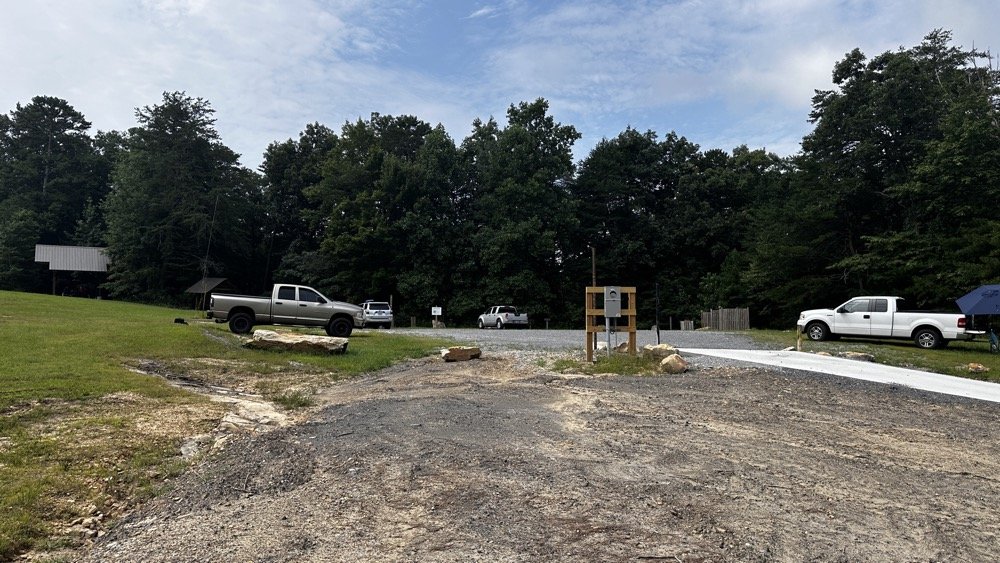
This view shows the tight conditions pretty good. The pavilion in the back has the SSB setup and the white truck had the other station with me kinda in the middle. As long as we used band pass filters or there was enough band space between us, I didnt have a problem. While I was on 10 meters I didn’t have a filter for that band, so I was open to interference and didn’t hear anything from the other stations. I know that at this time, one was on 17 meters and the other was on 20 meters. Band pass filters are a life saver as well as a little coordination between stations. When I arrived, the others were already setup and operating so I went over to each one and gathered some intel about how it was going for them and their current band so I could pick one that they were not currently on. They were both running band pass filters so I was able to start literally anywhere I wanted except 20 and 40 meters. I love the higher bands so that was when I cooked up the idea to do just the higher bands to see what I could net with that sort of restriction. It also allowed me to use my newly minted 17m band pass filter too…
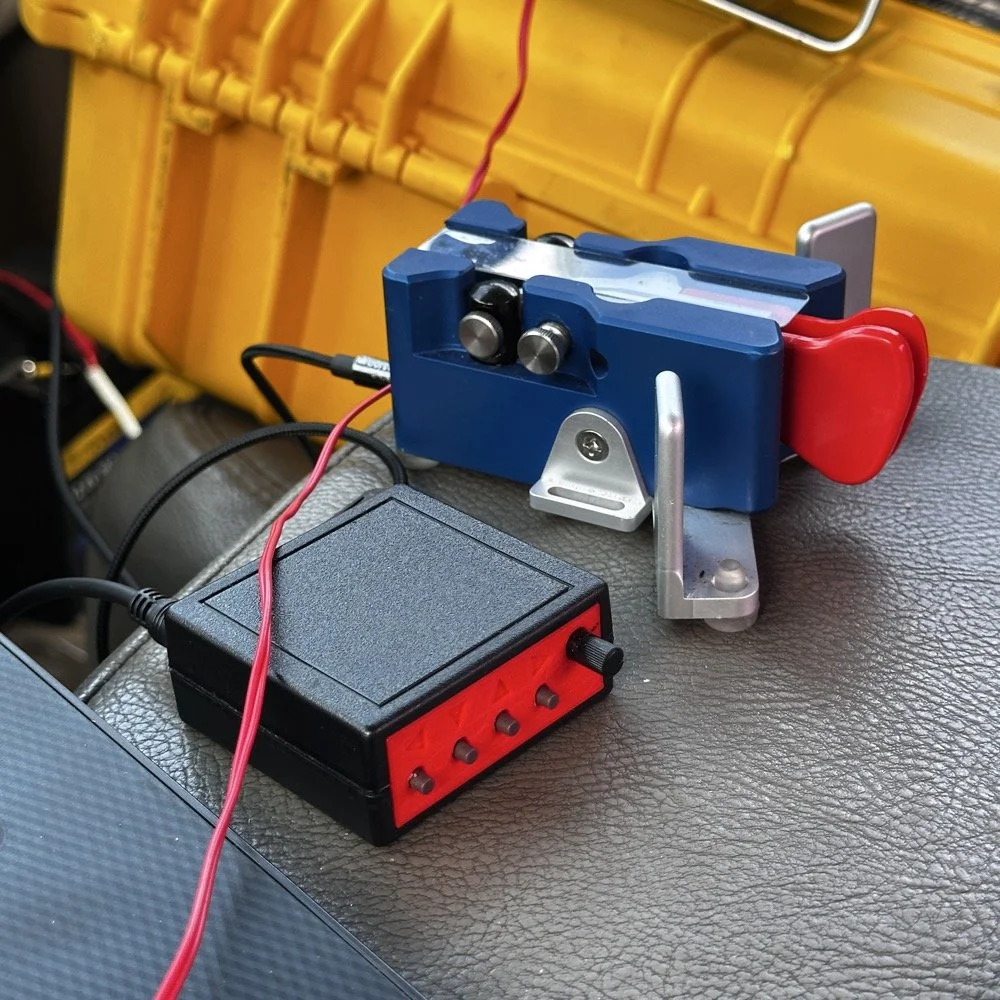
I cant say enough good things about this little keyer. The stark contrast between the cost of each item is not lost on me… I like things the work well and serve me without too much fuss. Both of these tools have done that well. I have finally used the keyer long enough to need to replace the battery in it. Which is a simple task, but does require a screw driver… I thought I would hate having a battery powered keyer, but to be honest, it is kinda nice being able to put it literally anywhere and it just works. I printed the operation manual and keep it in the case with the Scout 555 so if I need to do something in the menu that I dont remember how to do, I can just look it up right quick.
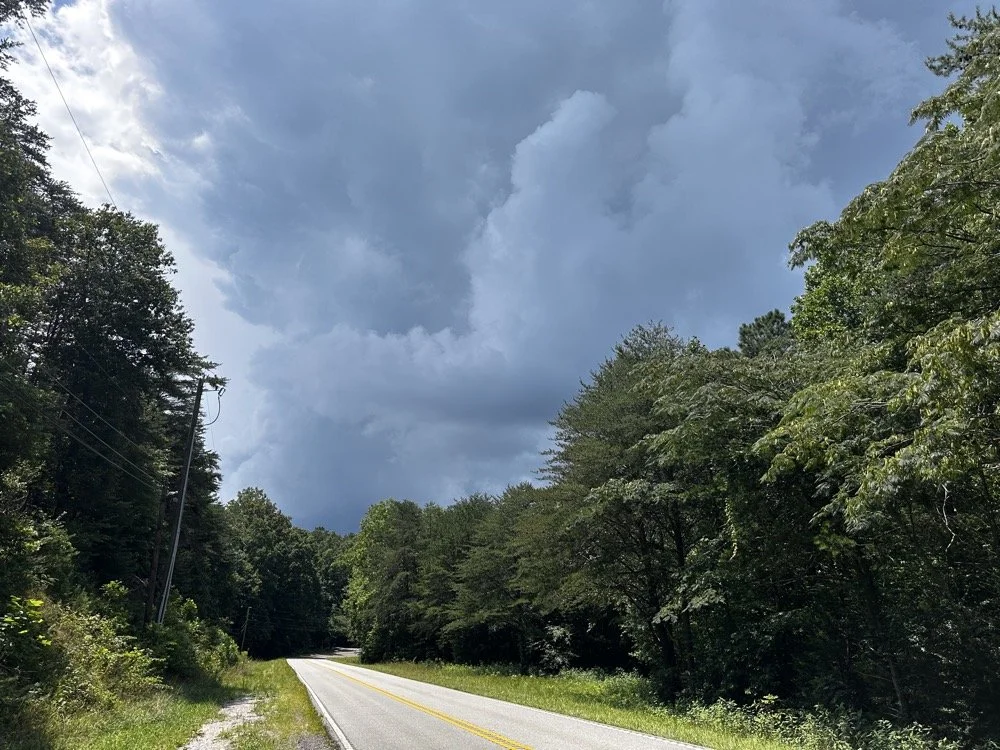
At the end of the activation, I had to break down early and go run some errands and I did itjust in time too as this was what greeted me when I pulled out of the parking lot onto the main road. Sometimes you just get the right amount of things to happen in the right order I guess…
You can help support this channel by using these Amazon Affiliate Links as well:
QRP/Portable Radios:
Antennas & Tuning:
CW Equipment:
Power & Accessories:
Organization & Transport:
BONUS ITEMS (Optional 16-20):
73
WK4DS - David
60m Band Module Part 5: SSB Operation
Getting SSB to work on a converted band module for 60 meters is tougher than I thought. It takes mods in the radio too…or it is not possible at all. One or the other is the fate of this TenTec Scout 555 HF radio and the 60 meter band module project.
If this is your first time seeing this project, please go back and take a look at the full series so you will be up to speed on this project.
- Part 1: Initial Conversion and Filter Design
- Part 2: Crystal Selection and Mixer Circuits
- Part 3: Field Testing and Troubleshooting
The Single Side Band Problem
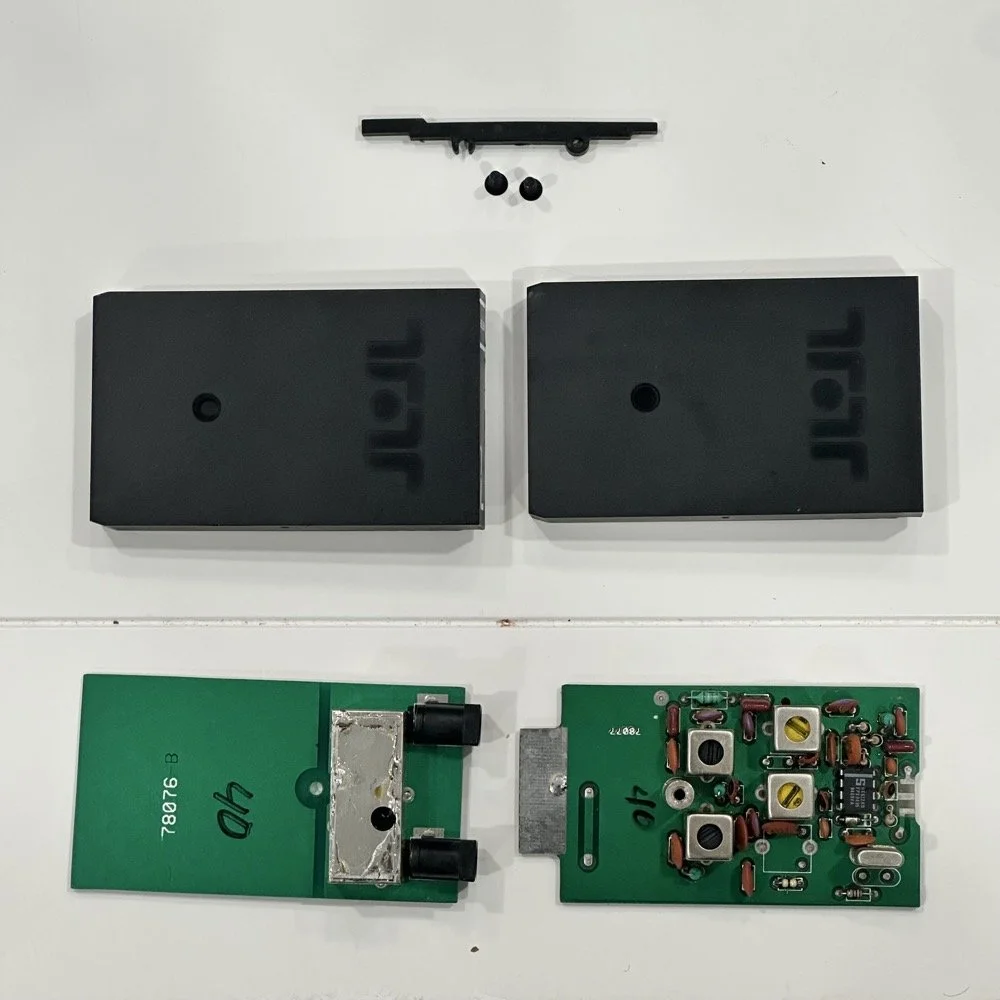
Today, we are taking a look at the TenTec Scout 555 60m band module that we built and figure out how to make it work on single side band properly. This band module was created by using a donor 80 m band module and from there things were changed and re-tuned to make it work on the 60 m amateur radio band.
One thing that has turned up though is that the 80 m band module operates on lower side band. To get the side band correctly oriented for the 60 m band I need it to transmit on the upper side band. This is not the normal convention for amateur radio operation though. The normal convention is as follows; bands 30 meters and lower, such as 40, 80, 160 and so on, will use lower side band. All bands 20 meters and above use upper side band instead. Someone a long time ago decided this was how we will do things going forward and here we are. Well for some reason, the 60 meter band is not like the other lower bands. It is using upper side band so I have to figure this out. The next step I have to do is figure out how the radio determines what band module is installed, and which side band it chooses. The radio automatically chooses either upper or lower side band, depending on the band module in use. So something is either telling the radio to monitor the actual frequency or it is looking at the band modules themselves and it is determining it that way somehow. All we have to do is figure out how it’s determining it and tell it to choose something different. Simple enough.
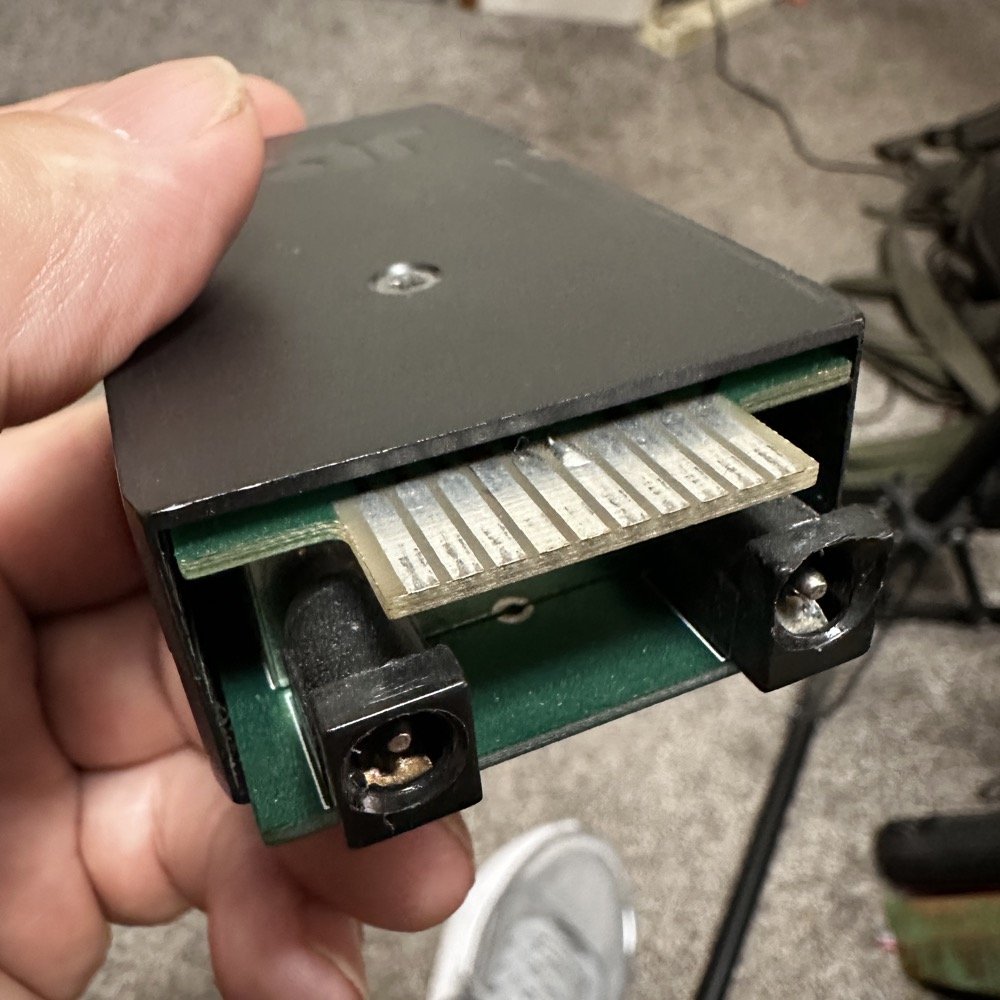
40 meter band module showing the soldered in ground jumper installed on pin 6.
Finding what triggers the shift from upper to lower side band
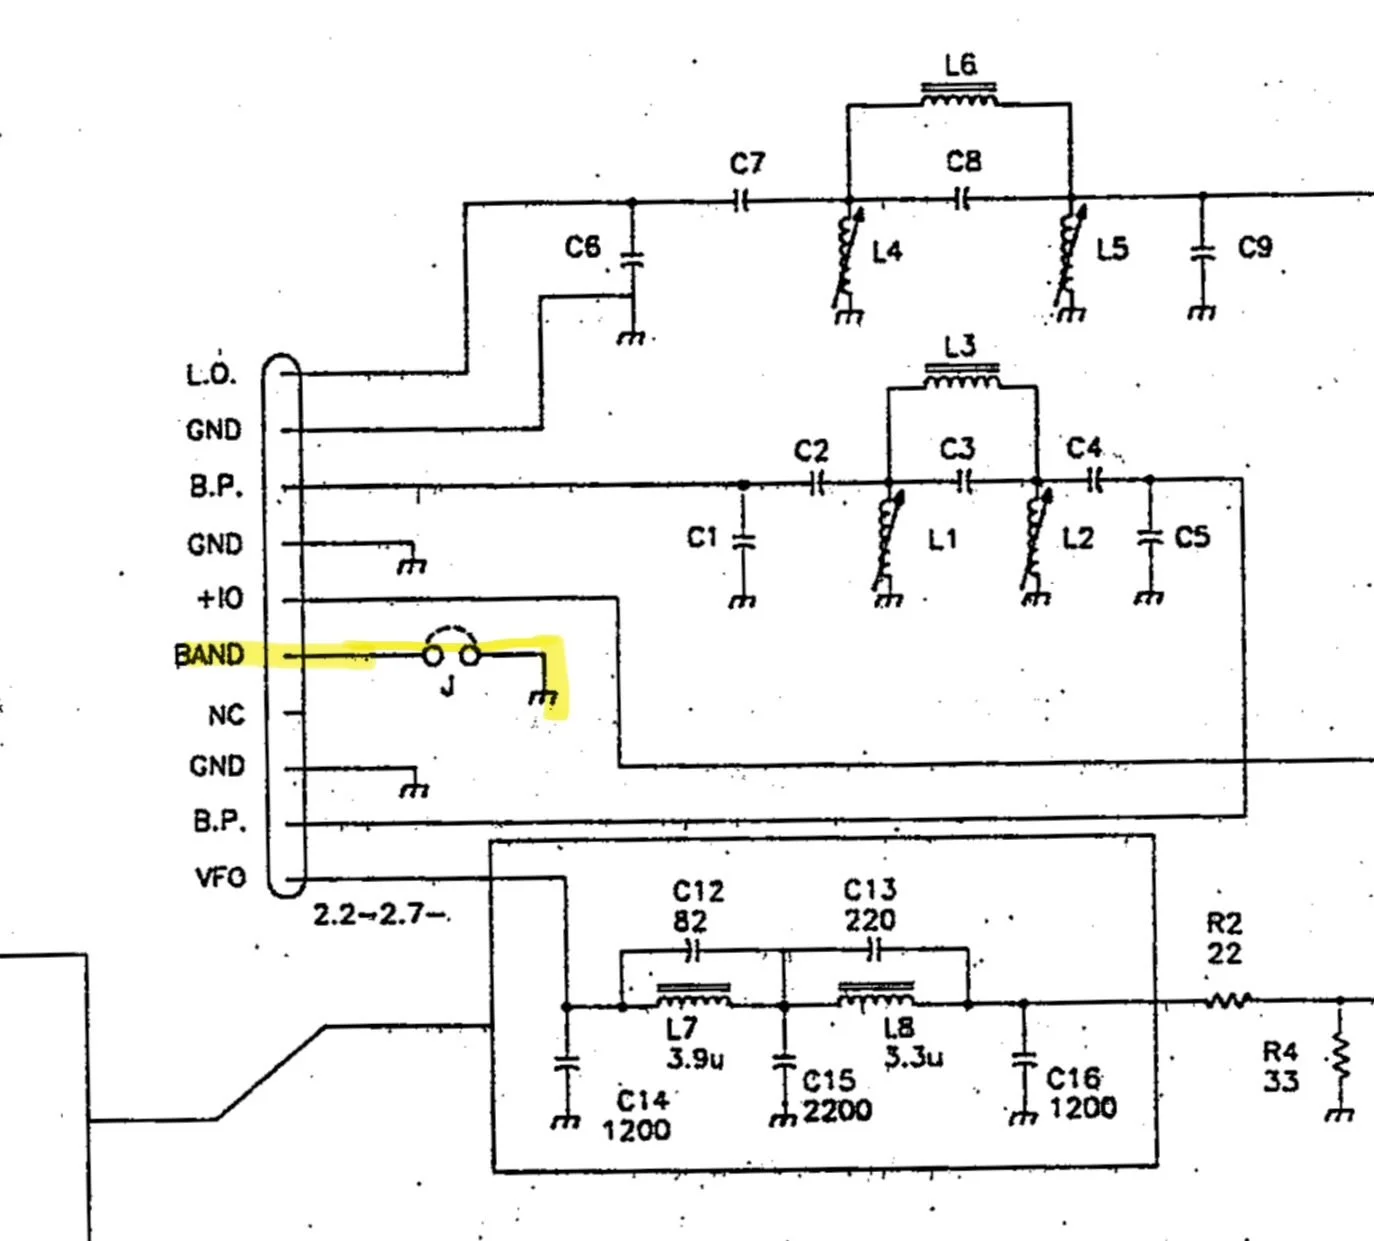
Everything we need to figure this out is in the TenTec Scout 555 owners manual. The manual has an complete set of schematic diagrams on the radio inside. I first start by looking at the band module schematic itself and found that there is a pin marked “band” with a jumper shown on it. This is a very suspicious connection and has me very interested in this particular pin. So this is where I’m going to start my journey since this sounds like it is what tells the radio which band the it is operating on. The next thing I had to do was figure out where it went in the radio, so I dig out the prints and found what follows…
The first image is an exert from the schematic of the band module itself showing pin 6 “band” being grounded with an optional jumper.
Band Module Edge Connector Pinout showing Pin 6 as the “Band” pin.
The next stop for this circuit is the Low Level driver board and it lands on a pin on connector 48.
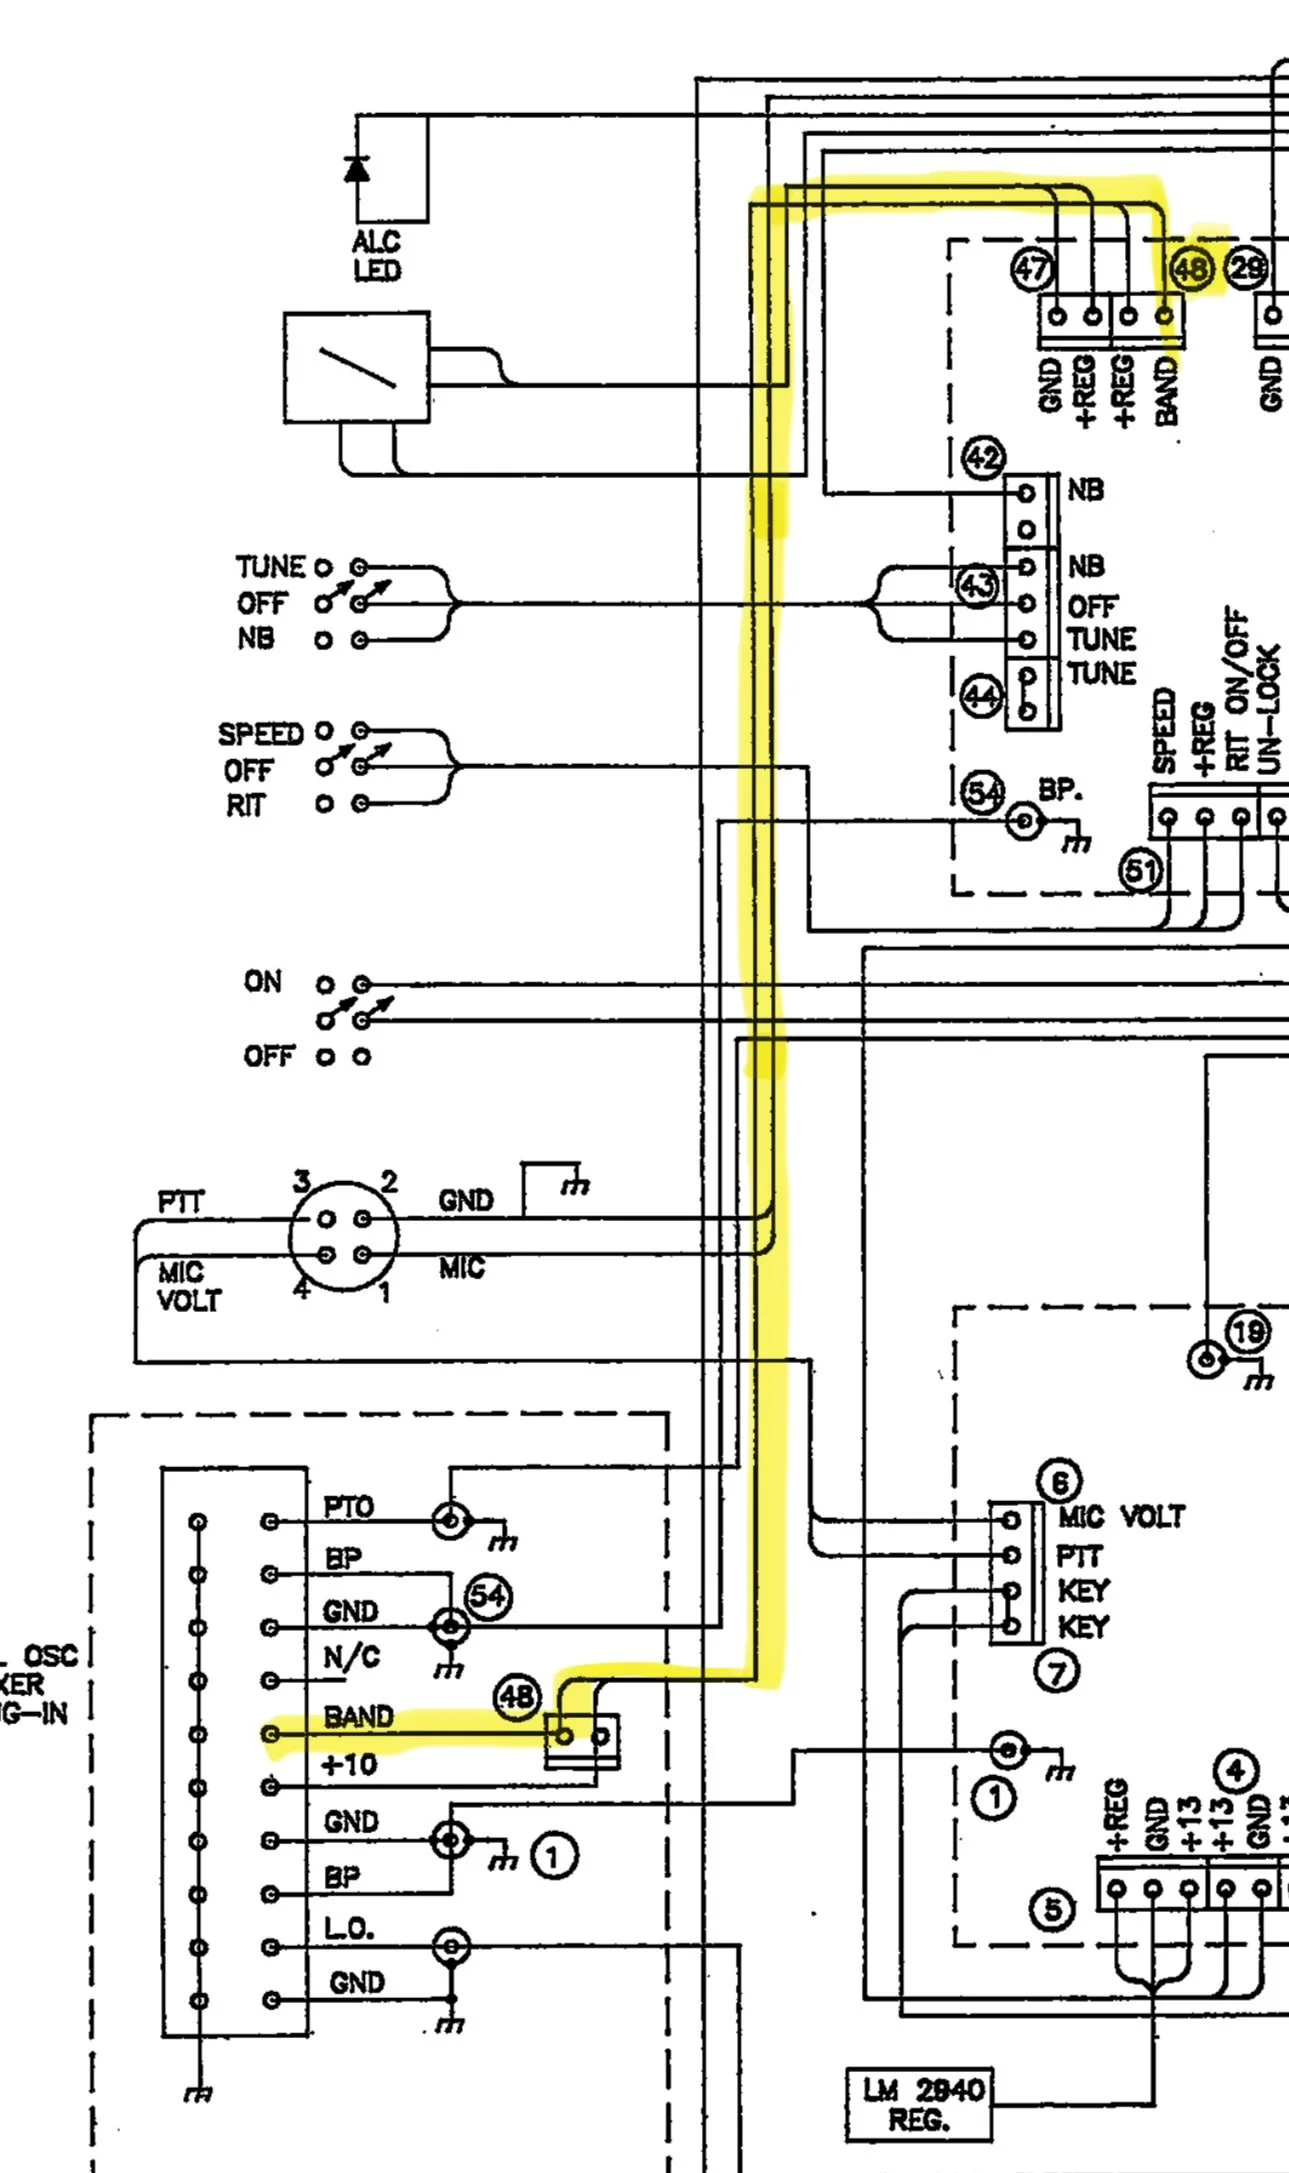
Section of the Low Level Driver Board Schematic showing the path from the “band” pin on the module edge connector up to a pin on cable 48.
It then travels along cable 48 over to the Low Level Driver board.
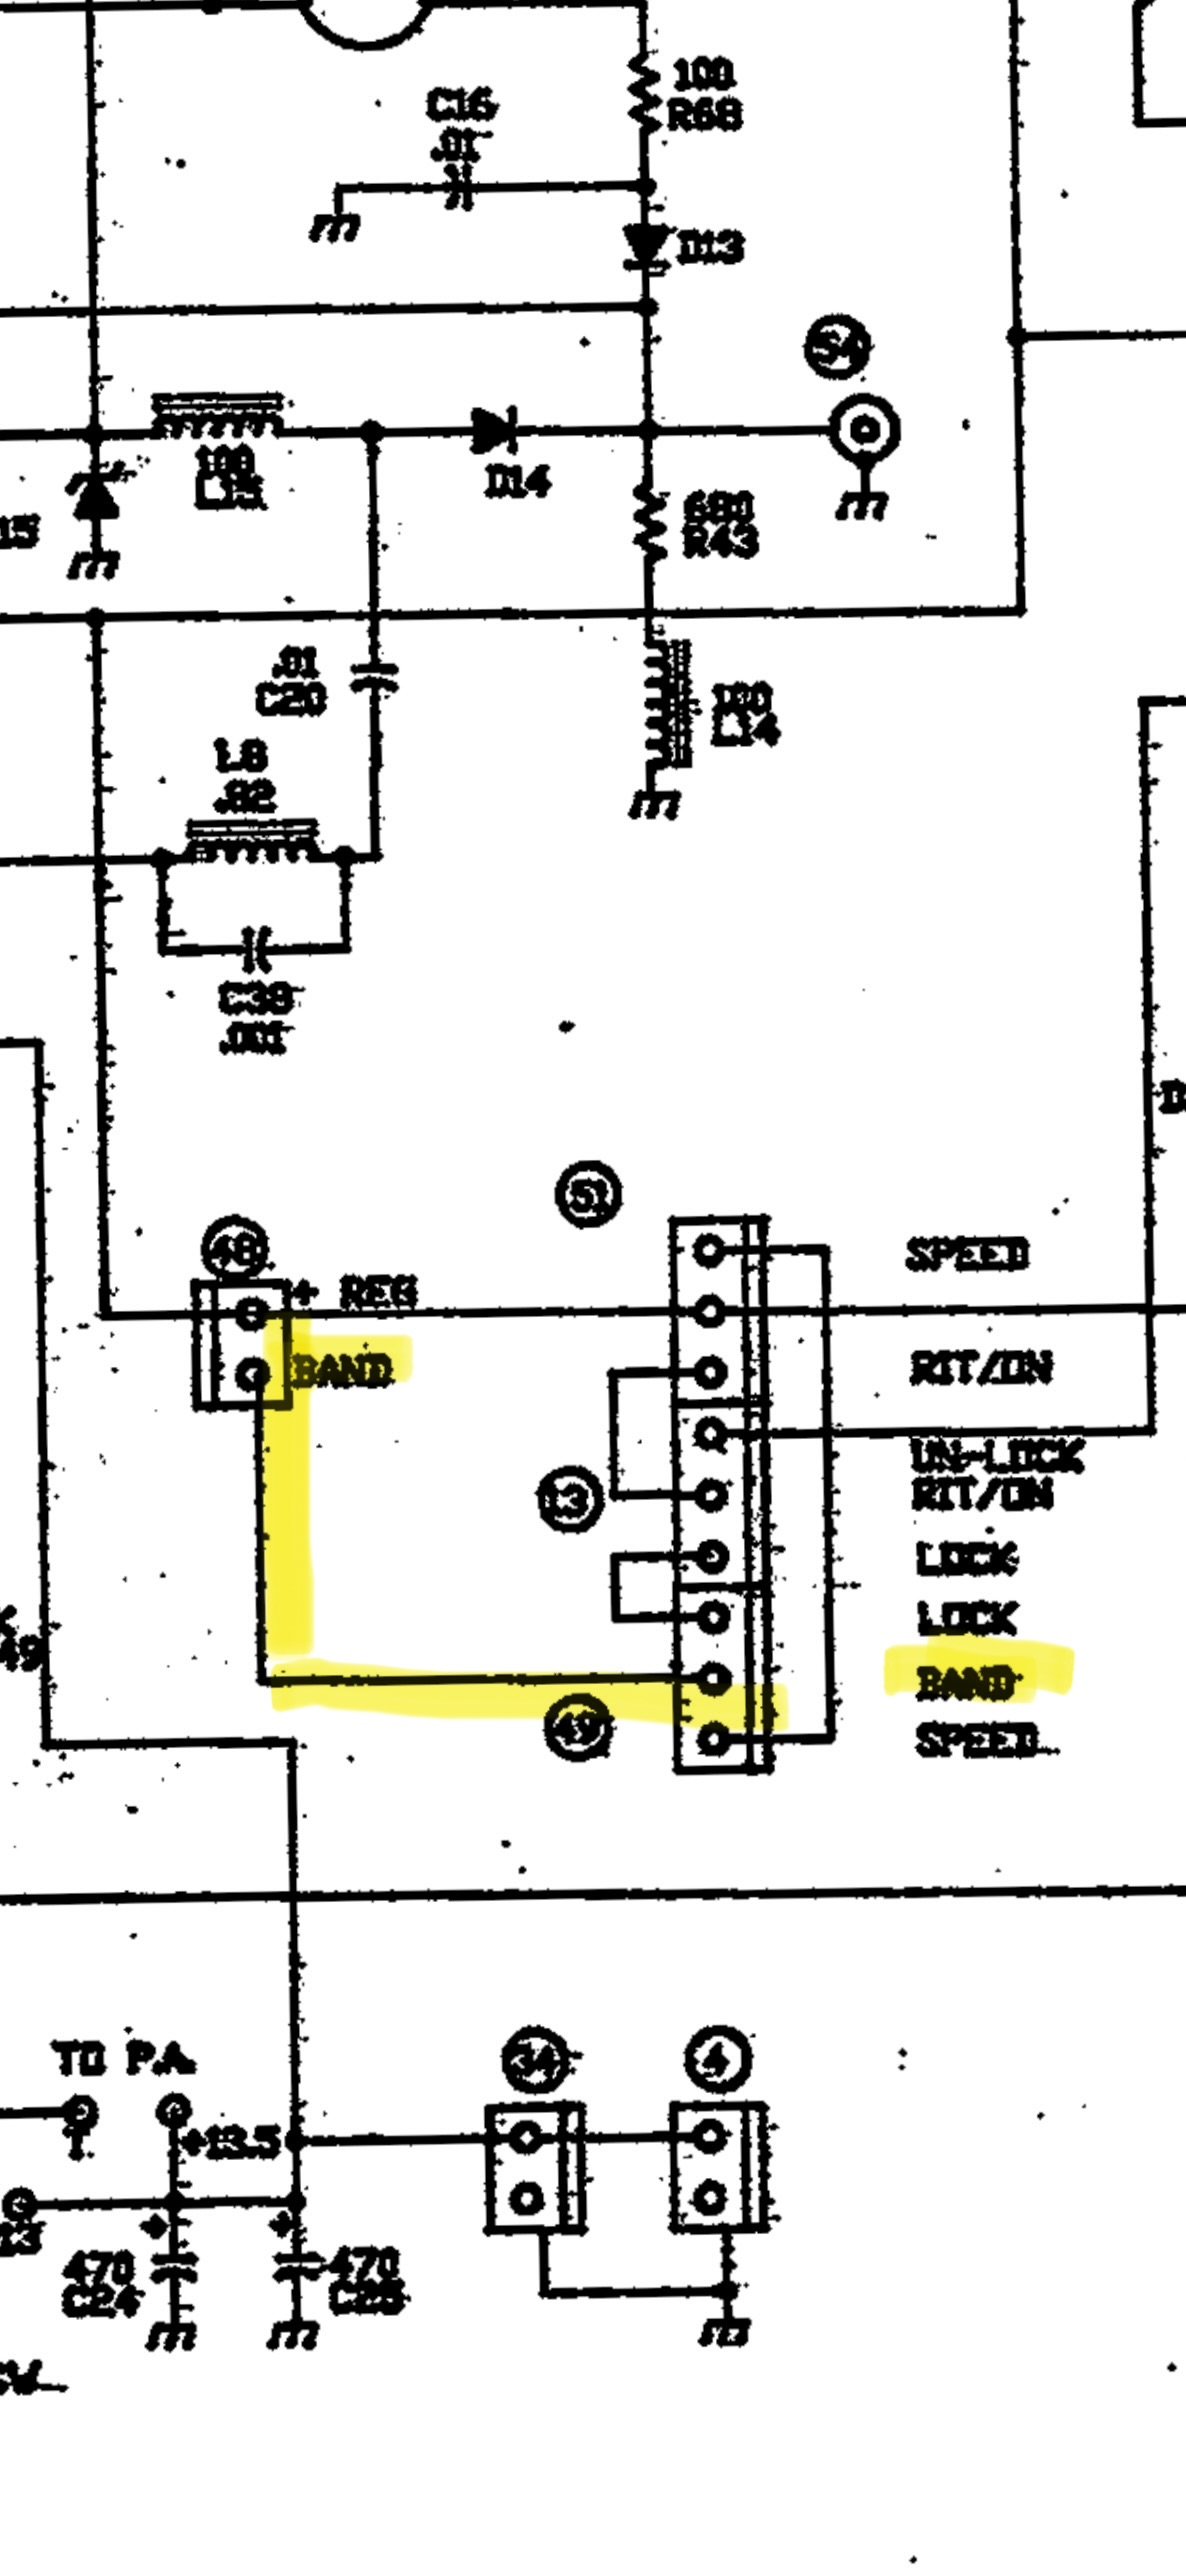
Low Level Driver board wiring showing connector 48 and 49 for the “band” selector.
The next place it went was from connector 48 to connector 49 on the low level driver board where it exited the low level driver board. I am going to be honest here, this wiring makes no sense other than to add two points of corrosion with bayonet connectors that are not needed. There was no reason to goto the LLD board just to exit the board without doing any work with this signal from the band module. Yet, so is life…
It leaves connector 49 on the low-level driver board and goes to the Logic board. Once on the logic board, it goes to pin 10 on the PIC16C57 controller Chip. This chip is probably being used to control all sorts of stuff, but this pin is being pulled low when the band module is grounded and it is being pulled high through R14 (4.7K ohm) resistor when the band module is not jumped to ground.
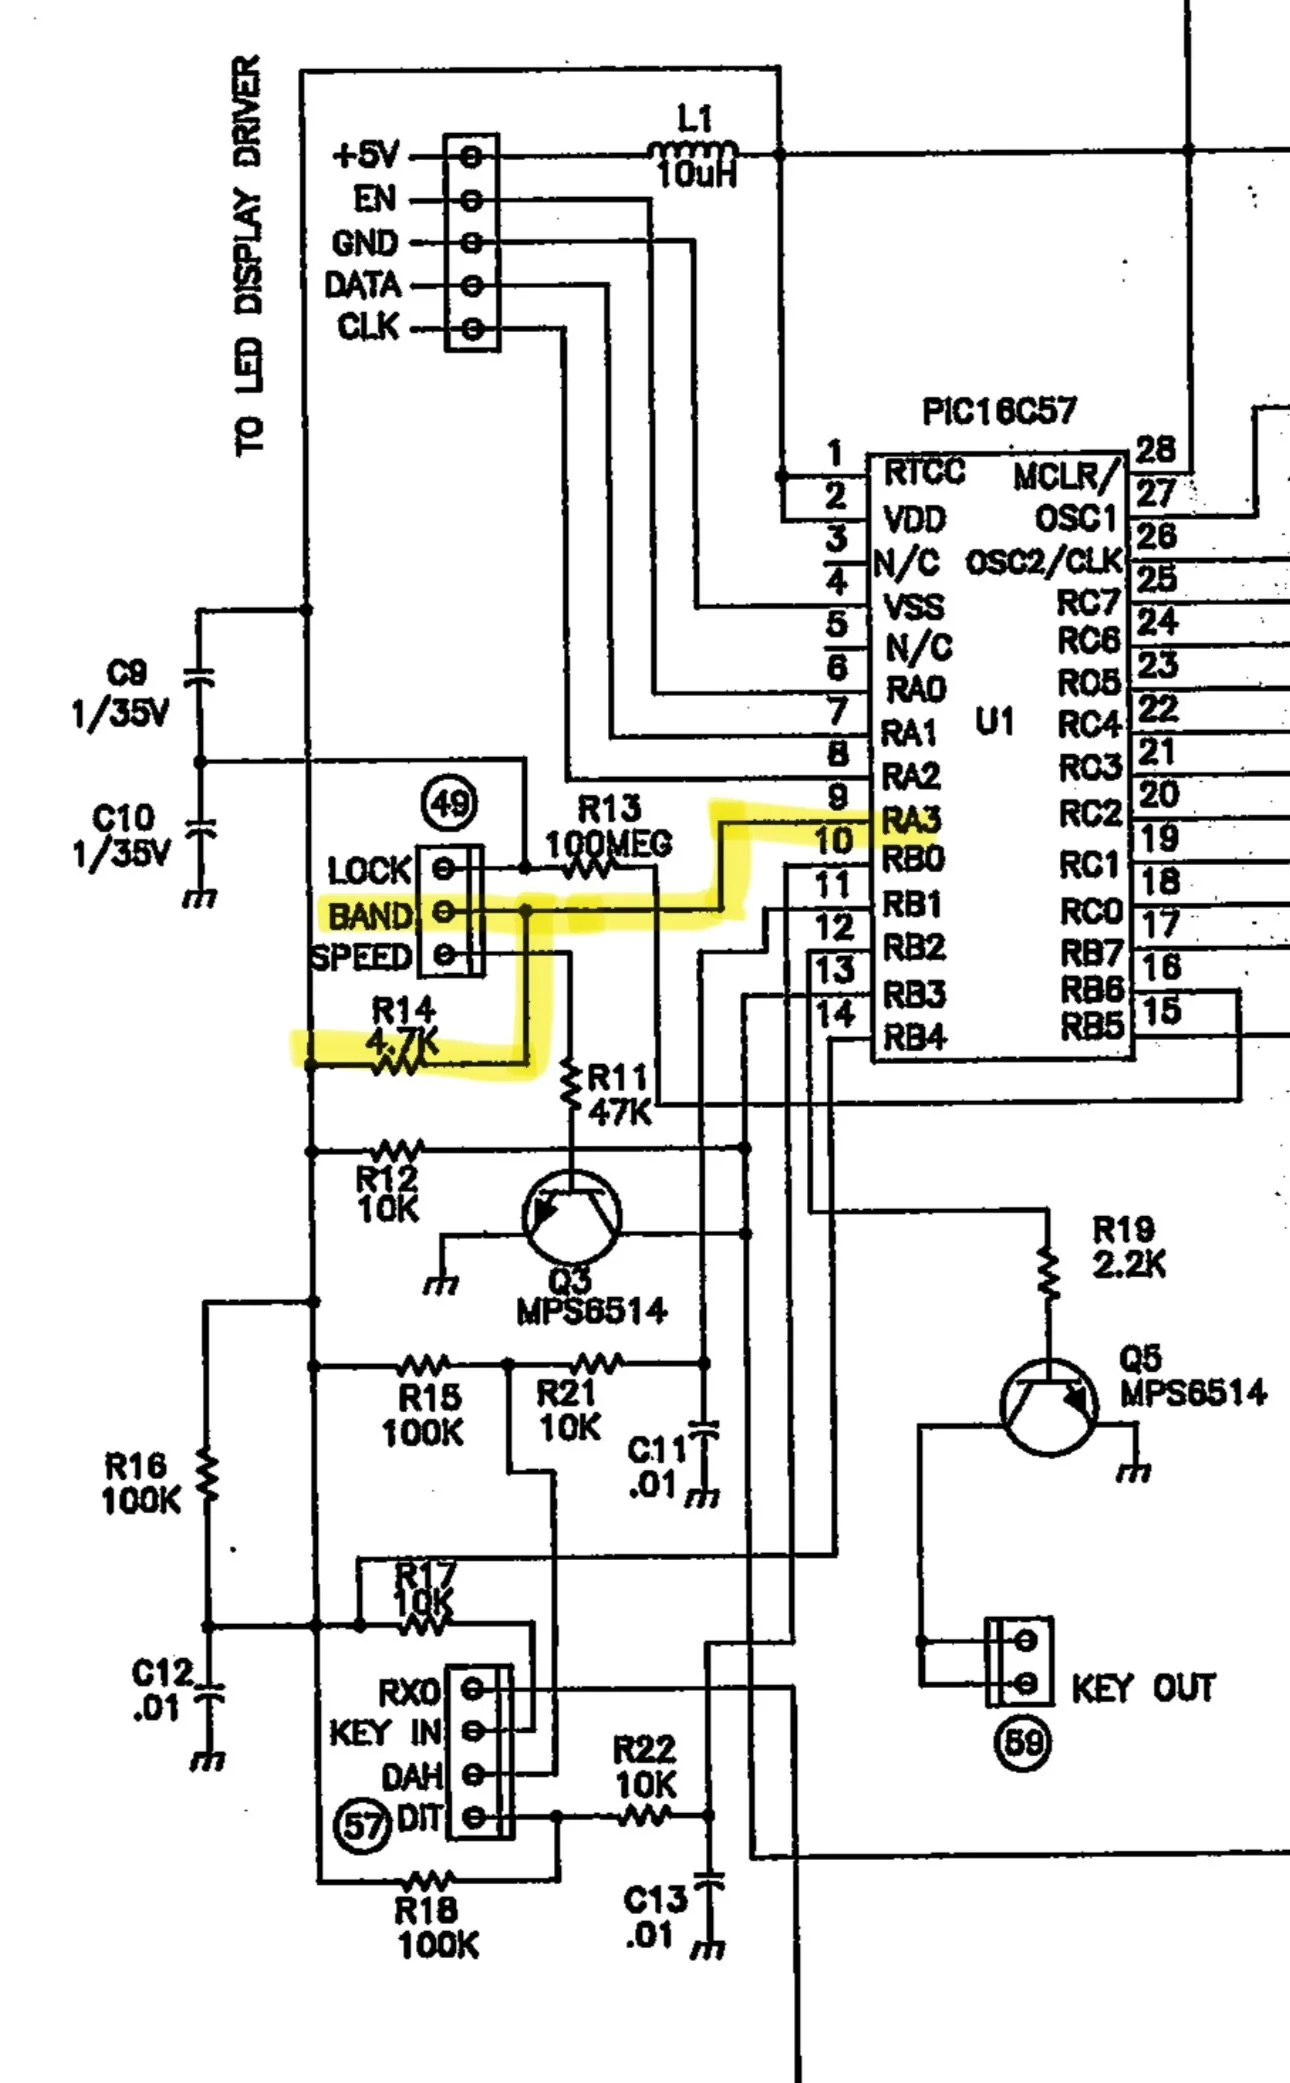
After tracking it down to the PIC controller, I have come to the conclusion that if you pull this line low (tied to ground), it determines one side band mode and if it is left ungrounded, it is pulled high by a pull up resistor to set another side band mode. So I went and retrieved my multi-meter and checked a full set of band modules to see and this is what I found:
10m - open
12m - open
15m - open
20m - open
30m - shorted
40m - shorted
80m - shorted
160m - shorted
60m Single Side Band on a TenTec Scout 555 is hard!
Once I saw this pattern I knew that this was how it knew what each mode needed to be. It had no way of knowing which band, but it knew which side band mode…or so I thought… As fate would have it, I learned something else today. I took my 60m band module to the workbench and de-soldered this ground contact so it would transmit on upper side band. Knowing that I didn’t touch any of the other stuff in the module I merrily trotted back to the shack to test it out.
Turns out more happens with the radio than just choosing the side band… Turns out there is a second thing that happens when you cut this trace. You see when you look at the chart of the frequency path on the NA5M website, you see that 30 meters and below, the 6.142mhz IF is subtracted from the Local Oscillator sum and 20 meters and above it is added. So when I cut the trace, the radio now transmitted on 17.616mhz and not 5.332mhz! Yeah, sure, now I had upper side band but now I was on the other end of the world from where I needed to be… Little good having upper side band does me if I am off frequency by over 10mhz!!!
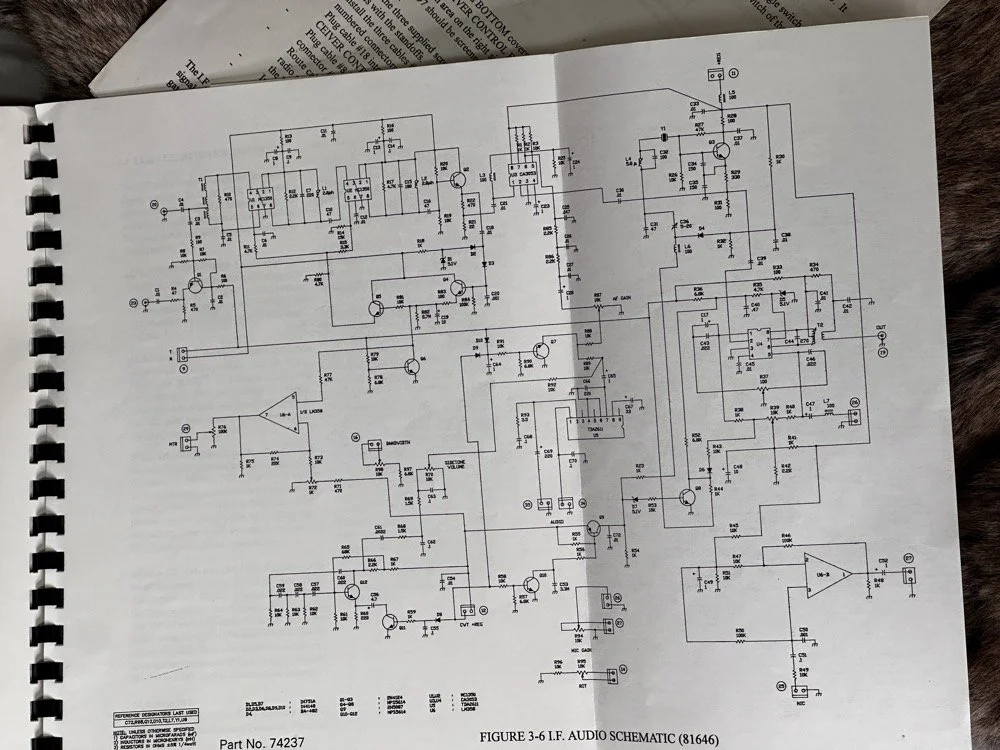
I figured out the following:
The band module has a pin on the edge connector that when grounded, makes the radio operate on lower side band and it subtracts the 6.142mhz IF from the signal. When it is open, the exact opposite happens. So what I need is for the radio to be like a “low band” module for the mixer, but use upper side band for the voice and some of the data modes. This is the problem I need to solve and the answer was on YouTube. After looking at the problem for a while and understanding how the two sidebands are literal mirror images of each other spaced out from the center frequency. I finally found a fellow ham from Australia that had the answer. Simply flip the audio frequencies only and adjust the radio as if it were lower side band. This sounds silly till you see his video. I currently have center tapped audio transformers on the way so I can build a circuit that mixes a 2500hz tone with the audio stream as the audio passes through a diode ring mixer. This will invert the frequencies when it does this. If his video is not fake, I will have solved the SSB problem on the Scout 60 module. Sure it will take an homebrew external converter module, but at least it will work! I have to invert the audio on both transmit and receive so I have to control the microphone input as well as the speaker output. The speaker is easy as I can simple grab the headphone jack audio and process it to a set of headphones or external speaker, but I will have to put microphone connectors on the unit as well so I can intercept the audio from the microphone as well as have it trip a relay when you press the “push to talk” button. All of this should be pretty easy to accomplish so I am confident this will work.
So here is the plan, I want to use that pin right beside the “band” pin on the module edge connector to ground it. Then I can route that to a new plug on the back of the radio to allow me to control a relay with it. This will “enable” the reversing circuit to get the audio corrected for use with this module. Since all the other band modules don’t use this pin, it will only work with the 60 meter module. This is if I have to build the circuit outside of the radio too. If I can get it to fit inside the radio, then I can make the whole thing look original and not need a small adapter to correct the sound and microphone audio. Other wise, I will be piping it through a converter box with the ring mixer in it and a relay to switch the path from transmit to receiver.
The TenTec Scout 555 owners manual has a lot of the information that I need to make this happen, but it doesn’t tell you everything. It mostly describes circuits so you understand what your adjusting it, to trim it back in and get it running right.This means you have to figure out what is going on with the circuits so you can understand how to modify them. This is the hard part for me. For now, at least, the SSB problem remains. I hope to be able to solve it, but right now it looks a little unlikely…unless you know something that I dont and see it in the photo of the schematic above.. haha. If you see a possible solve, please email me or leave a comment and lets talk about it, I am really enjoying this project and would love to get that one last mode to work right.
You can help support this channel by using these Amazon Affiliate Links as well:
QRP/Portable Radios:
Antennas & Tuning:
CW Equipment:
Power & Accessories:
Organization & Transport:
BONUS ITEMS (Optional 16-20):
73
WK4DS - David
Smith Chart Exploration for Ham Radio: Building Impedance Matching Networks with DIY Inductors
Today finds the unsuspecting ham radio op perusing YouTube for something new to learn as it is really cold outside. He stumbles across a video about using a Smith Chart to match impedance and is intrigued…
What happens next is kinda terrifying…lol
Well to be honest, it is really kinda boring till you see how a smith chart sort of works and you start to learn how to use it to some degree. I have known about them for years, but have never understood how they work or even how to read them.
Today finds the unsuspecting ham radio op perusing YouTube for something new to learn as it is really cold outside. He stumbles across a video about using a Smith Chart to match impedance and is intrigued…
What happens next is kinda terrifying…lol
Well to be honest, it is really kinda boring till you see how a smith chart sort of works and you start to learn how to use it to some degree. I have known about them for years, but have never understood how they work or even how to read them. The other day though I landed on a video. This one shown below to be exact and I was hooked.
As you can see, if you watch this video, (maybe a couple of times), he explains it in simple enough terms that I actually understood what was going on finally! I did come into it with the understanding that the upper half was inductive and the lower half was capacitive from tuning my antennas with the nanoVNA. I would leave the smith chart on out of laziness and simply used the SWR graph to move the null to the operating frequency. But during this time, I started looking at the information presented on the display and noticed at times it would show capacitance and sometimes it would be inductance and also where the marker was sitting. This gave me the clue about what it was sharing with me. That was the extent of my smith chart knowledge though. At least it made sense to me. So the next logical thing to do was to order some smith chart notebooks from Amazon and a drawing compass so I could use said charts. While I was anxiously awaiting the new goodies to arrive, I started binge watching videos on smith chart use and taking away what I could from each video to add to what I already knew. By the time the paper arrived (I know I could have printed them off the web but the notebook format is really nice to be honest) {sarcasm}I was already a “master” at these “simple” charts… haha. {/sarcasm}
I will be honest with you. There is so much about these charts that I still don’t understand that it boggles the mind, but I have figured out how to use them for impedance matching and it is kinda awesome. I actually made the last few pages in my new notebook a cheat sheet based on the above video so I could reference it easily without having to watch the video over and over. I am absolutely going to build one of these fixtures when I get back home too. I would already have done it but I am not able to access my bench to put it together… So what follows is what you do when you don’t have that gear handy.
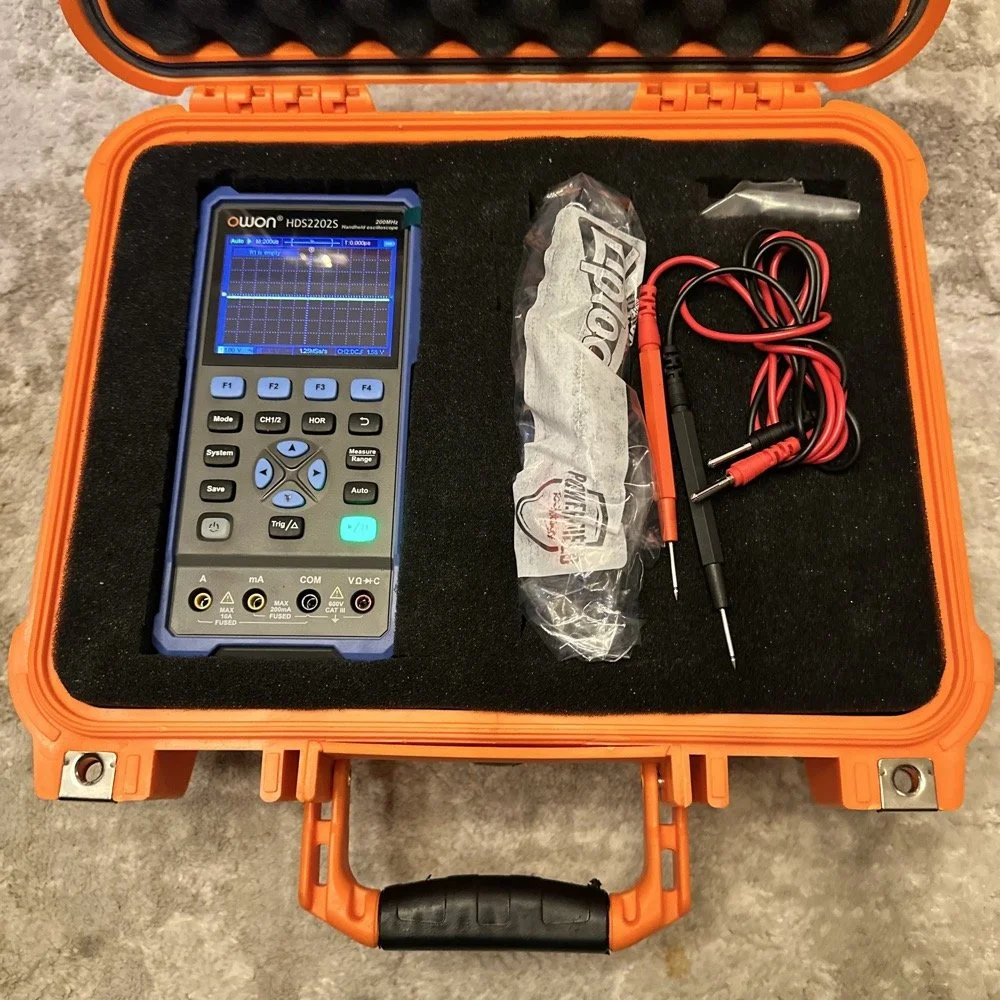
First things first, I bought a new toy. This is a 200 mhz “scope meter” but this one has another trick it can exploit. This is a actual dual channel oscilloscope AND it also has a arbitrary waveform generator as well! On top of the usual multi-meter functions as well. This thing has a lot to offer…till it doesn’t. It didn’t take long to figure out that the waveform generator doesn’t have the sweep function in it, this would have been nice to play with things. I can’t find FFT modes anywhere in it either so it can’t be a “poor man’s spectrum analyzer”. The little meter does have enough options to be really useful for what I was doing anyway so let’s get started… oh, it doesn’t come in this nice hardshell case. This is an Apache case from Harbor Freight. It is the perfect storage container in my opinion and I am happy to have it trimmed out like this. It didn’t take too long to figure out how to use the oscilloscope and I made a cheat sheet for it too so I can access useful features more easily in the future since a lot of it is hidden in menus due to the diminutive size.
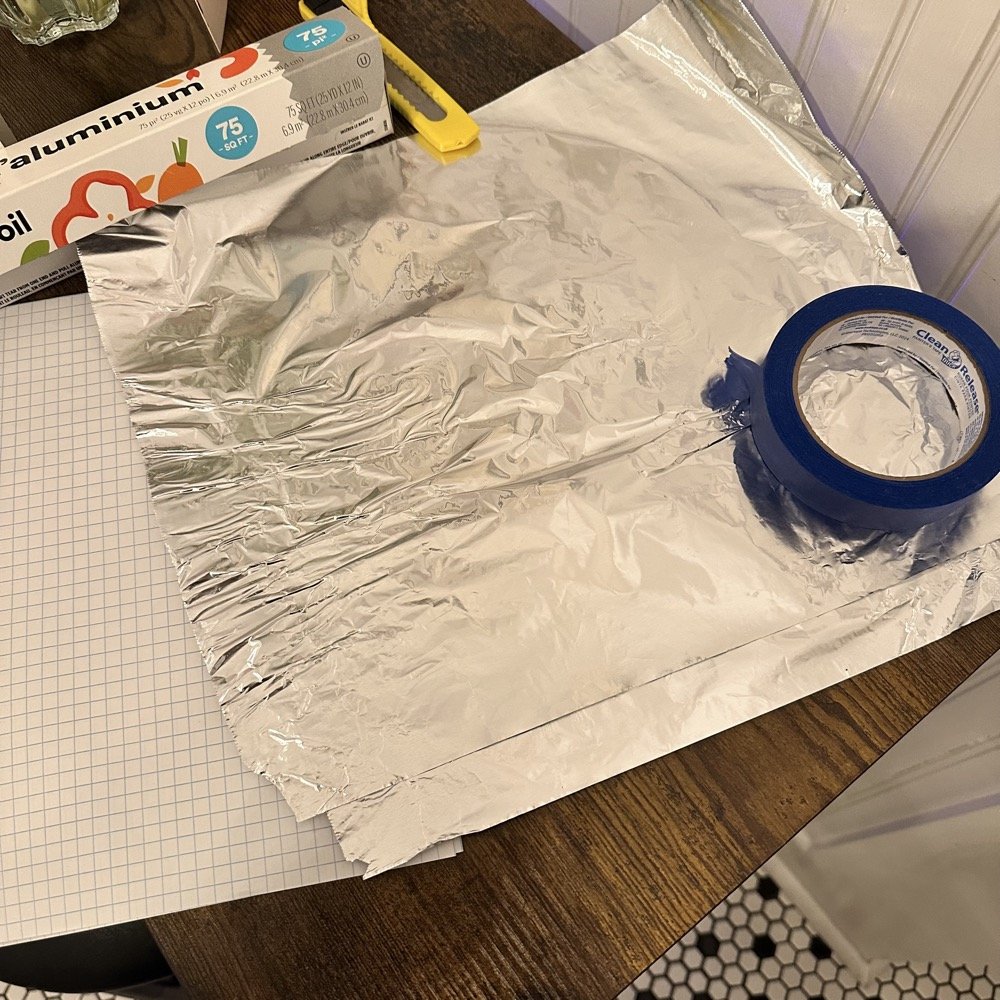
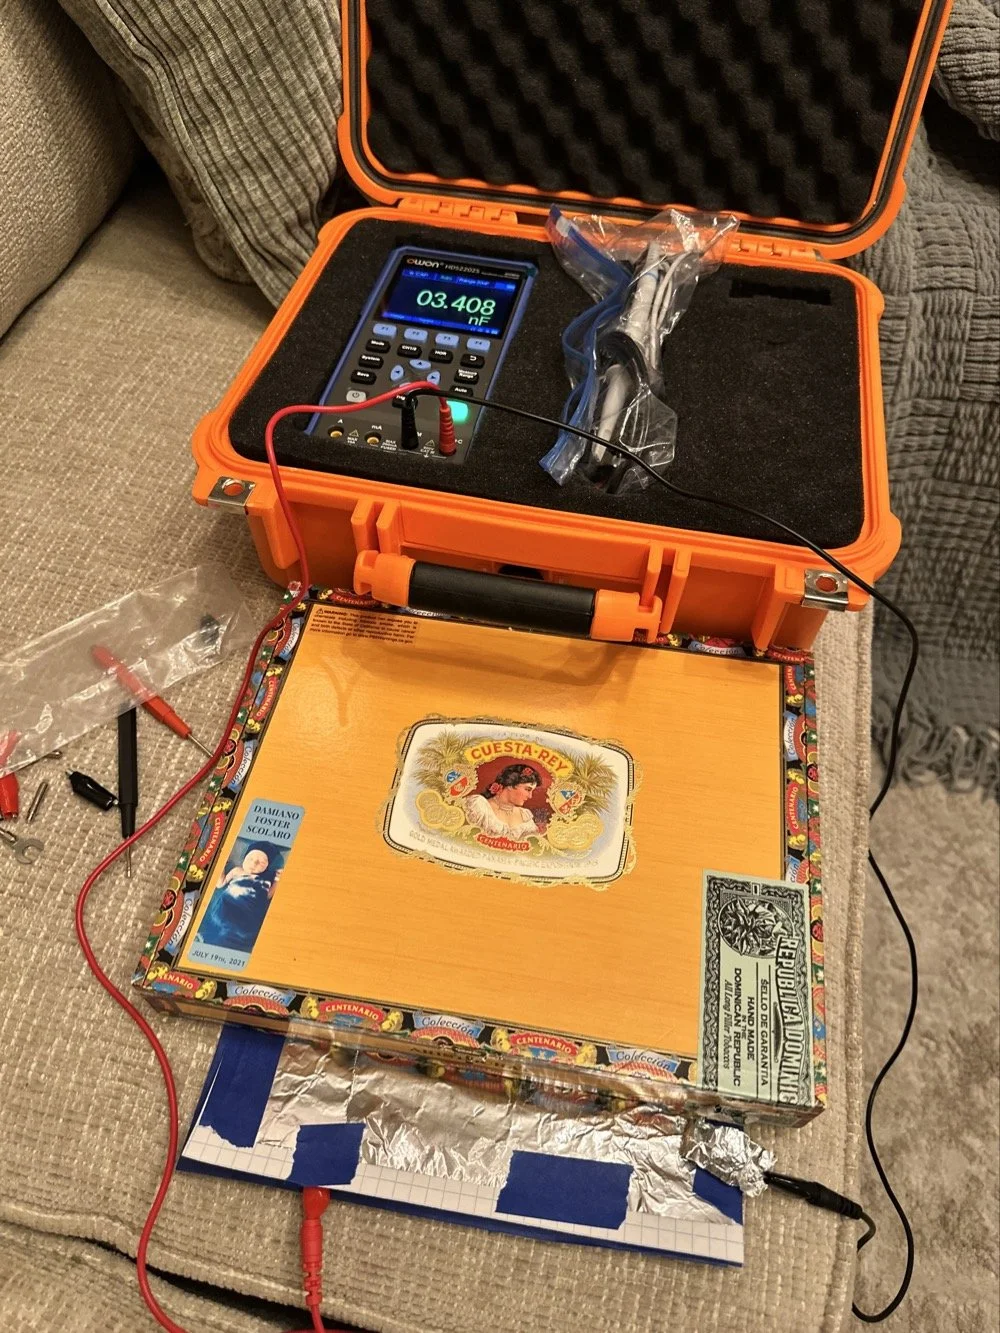
What you see here is pure desperation to see if I can make this smith chart stuff work for me. I am literally about to start making capacitors out of aluminum foil, a sheet of notebook paper and painters tape… Spoiler alert, it worked… You see, in another video I found on YouTube, there was this idea that you don’t need a LCR meter to measure your components as long as you have a known value device, a battery and some ingenuity. I also had a lot of time to play with this concept so here we are… I started by making a really big capacitor to start with to do a proof of concept and to see if there was enough capacitance to make this project work. Turns out there was way more than needed with the initial design, WAY more. So with the proof of concept made from three full size sheets of paper laminated with aluminum foil on one side of each one and then stacked so that the center sheet was one plate and the top and bottom were the opposite plate, I found I had made a .0034uF capacitor! This was more than enough to play with HF radio RF frequencies!!! Woohoo! Now this is all based on me being able to believe my new meter and later I find out that there is 17pf of stray capacitance in my meter and leads. Once I figure this out, and factor it into my math, it is all good but for now with this thing being 3408pf, I don’t think it is really a problem. The cigar box is there to use gravity to apply an even pressure to the “plates” and hold them at a consistent spacing as at this point, these were just three sheets stacked up. The top and bottom are connected to the black lead and the middle one is connected to the red lead. Also tested it with just on plate on the black lead and yep… capacitance went WAY down, so this style of capacitor worked pretty well to be honest. I could make it go up a good bit more by pressing on the cigar box too, I saw 5.0nF at one point while playing with it, that is crazy to me…
I had read somewhere about this idea to be honest. Well a cruder version of it actually. They made an impromptu antenna L network with two sheets of aluminum foil and a sheet of news paper or something like that. That made the capacitor and the inductor was wound on something found commonly in the house in the 1960s or 70s as well. They just used regular old romex house wire to make the inductor and it also worked just fine. Sometimes you just really need to have some “want to” and it can be done. I was a little more superfluous with my build as I didn’t need it to get on the air but rather as an experiment to see what I could learn.I honestly was really surprised to see how much capacitance I could get out of notebook paper and aluminum foil from the grocery store. This tells me that literally anyone that needs an antenna tuner, has one if they want it bad enough. You don’t have to have a Ten Tec 238 to be able to tune that random wire, you just need to gather some stuff you probably already have in the house…
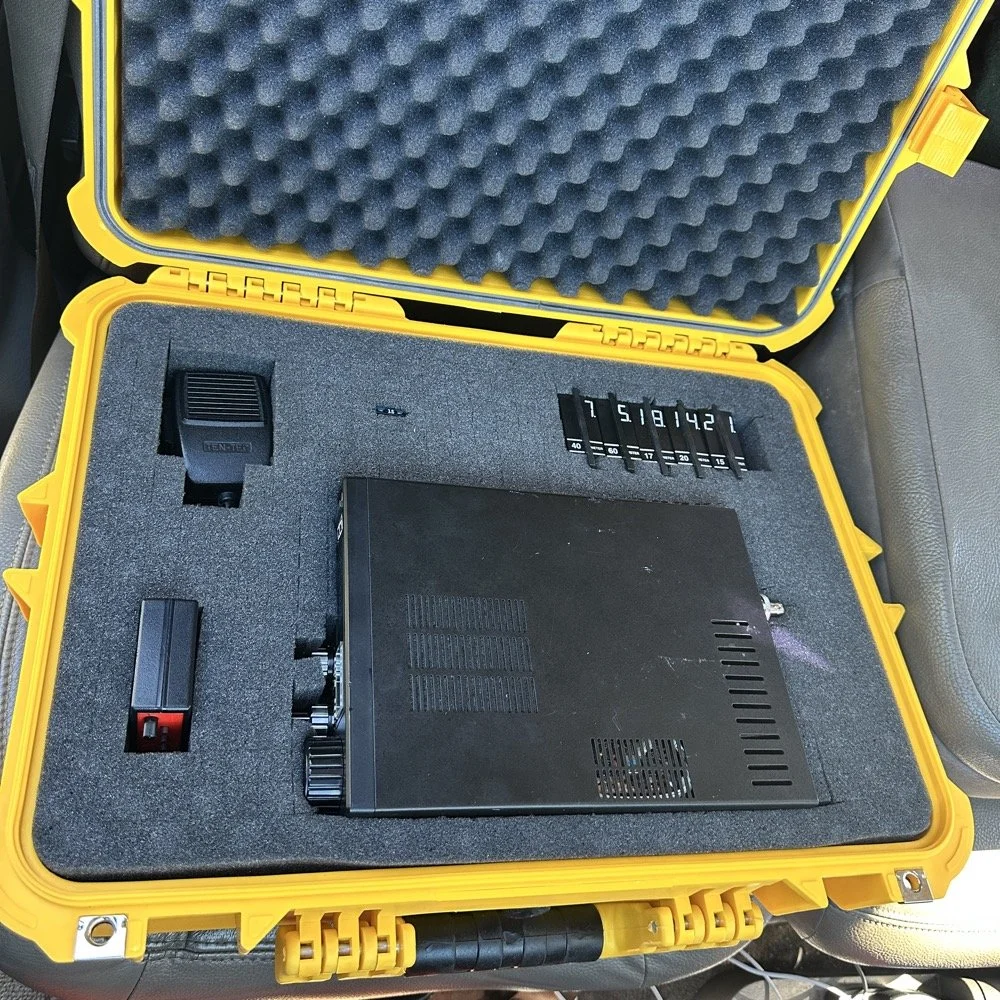
Side note, I also finally acquired a new case for my POTA Scout 555 radio. I still need to finish the pockets for the band modules when I get home, but I now have it in a proper case and not just sitting in a cardboard box in the back of the truck! Also, I made another 60 meter contact today… to the same exact person that I made the first one with a couple weeks back! HAHA! I think we are the only two people on 60 meters CW in the mornings ever…
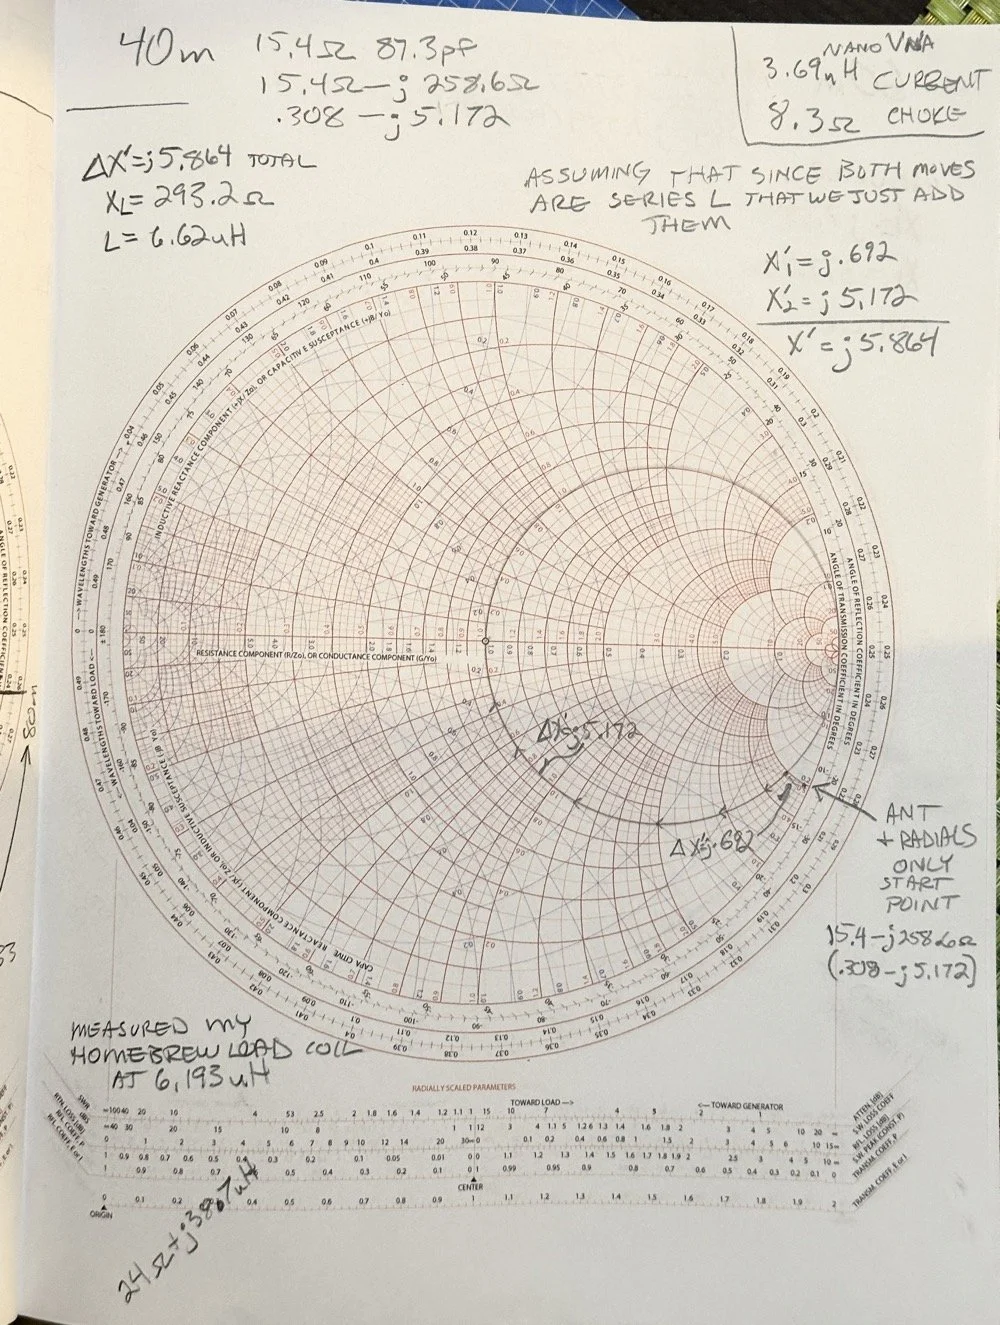
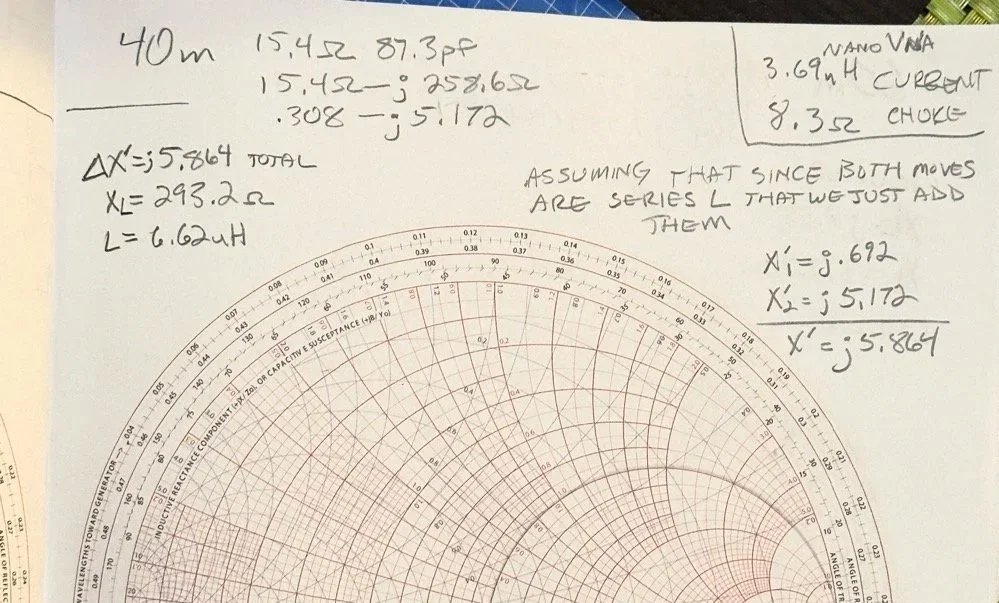
Here we see what I measured the other day while at a POTA park. What these numbers show is the antenna measurements for the band at the base of the antenna. I literally took the nanoVNA and adapted it to the antenna socket directly to eliminate the 50 ohm feedline from interacting with the measurement. As we will learn soon enough that you can use a piece of feedline (coax in particular) to move the base value around the smith chart should you need the starting point to be somewhere else. But I also learned something else about these starting point numbers below that I will share with you in a little bit.
At the top of the page, right next to the “40m” is what the nanoVNA reported that day at the park. (15.4 ohms and 87.3pf) you have to have two coordinates to plot anything on a chart so these are the two numbers you need to plot your starting point. Ignore the other notes as I am probably wrong on some of it and it actually makes more sense later. But the first thing I had to do was to turn these numbers into the proper numbers that the smith chart uses. This is called normalizing them. You see the chart is relative, you can assign whatever value you want to the center point on the chart and the rest of the chart is “relative” to this value. So if you were to work with 75 ohm coax and wanted to make an impedance matching network to work with it and having minimal losses, then you would assign 75 ohms to the center point. Since we use 50 ohms in almost all amateur radio (if not all) then our value is 50 ohms at the center point.
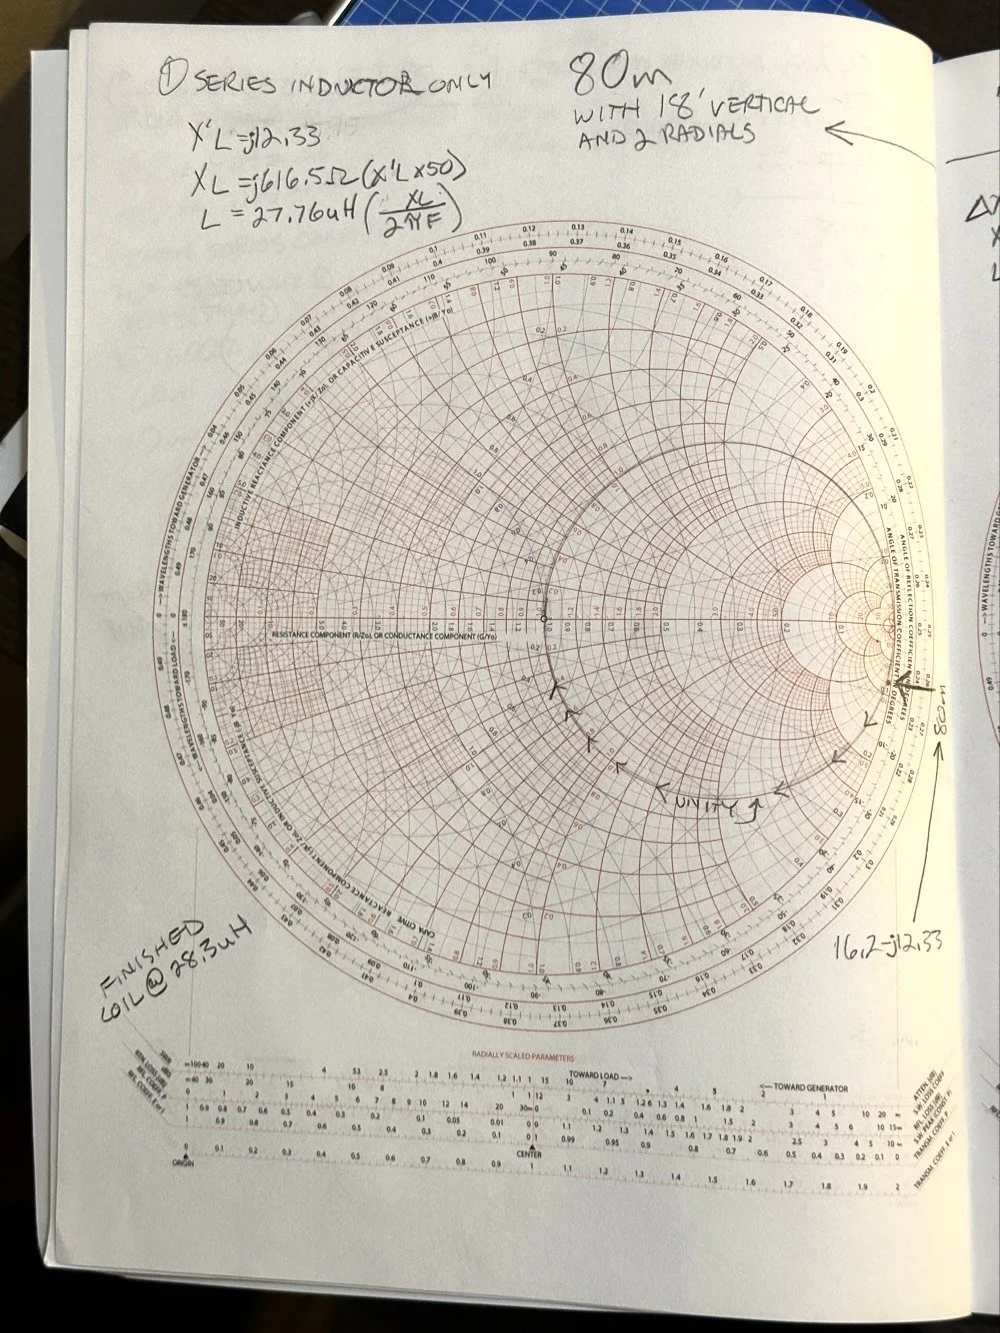
So here is my 80 meter plot (below) to get to a 50 ohm impedance from where it started at… yes… 1 ohm and 79.7pf capacitive! You see I am designing a matching network to couple my 50 ohm coax to a 18.4 feet tall telescoping vertical with a couple of radials thrown out on the ground. This is not even close to a matching antenna for the 80 meter band at all. Hence the terrible numbers to start with. Well, this was like those jokes you here from high school where you get something simple in the lecture in class about a subject then in the book it might show it with one more complication but the exam shows the Drake equation for the problem on the test! Well this is what happened to me as in the video above, the number in the video was closer to the middle of the lower half of the chart making for a more straight forward solution to the problem. I also did my admittance math wrong too if I am right…lol… since it is all inverted, but this doesn’t matter at this time. What you need to know at this point is that my problem lies outside the unity circle (that is the one I drew on the chart) and I need my “arc of movement” to cross this circle… it does but nearly at the infinity point (on the right side of the chart) which makes the math almost worthless… The reason the math gets pretty inaccurate is the numbers on the chart start getting logarithmic is value and so a small movement on the chart in this area makes huge changes in the values. You want your plot point anywhere else but here, yet this is where I am at in this blog post… haha
Knowing all this, I start this complicated, 3 position move to get me to the center of the chart. Mind you, I think this would actually work, but I am not sure if the math is mathing right at this time. (I am thinking the first move is a piece of transmission line to move the start point around the circle instead of an inductor and the second movement is also not a capacitor either so basically this whole thing is drawn wrong…lol) You will see why in a minute too as to why I dont know. The schematic for this movement is scrawled in the upper left hand corner of the notebook page if you wondered what it would look like to make this circuit. Two inductors and a capacitor to get to 50 ohms… how many antenna tuners have TWO inductors in them? I will help you out here… not many, if any. The number of inductors alone would make this a no go design for the most part unless is was going to be a one band wonder. Just remember I am pretty sure the math on this is wrong, the plot directions are correct, but I am thinking that the suseptance values are needing to be inverted to calculate the impedance for the two movements on the blue lines. Anyway, the point of this blog post is to show what is possible if you want to learn something new and it is not about the math around a smith chart…yet…lol I am diving back into the tutorials to figure out the blue part of the chart next.
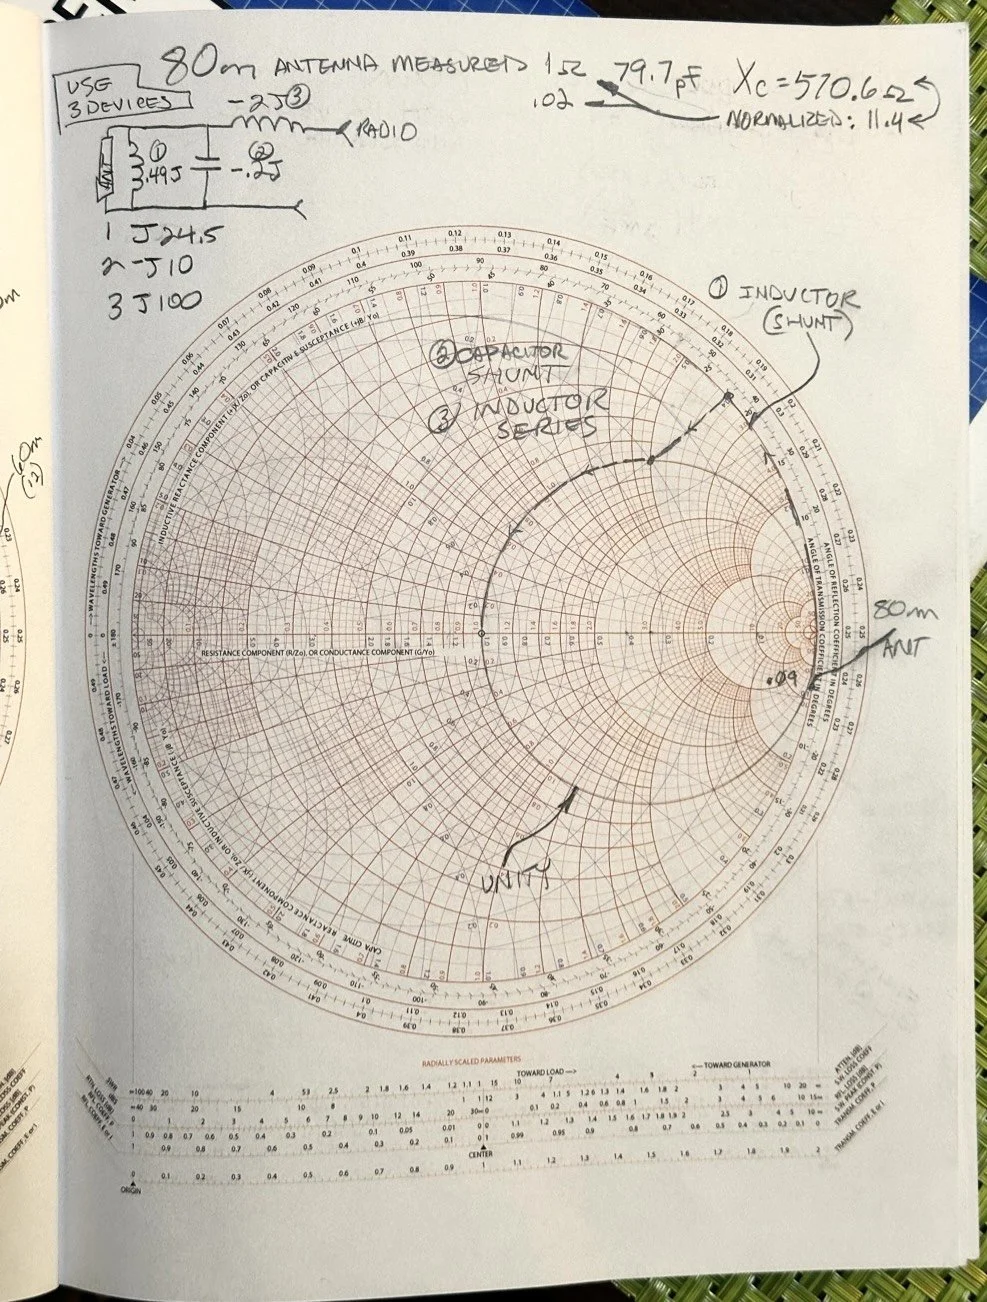
After I pulled my hair out for a while…wait, that don’t apply to me…I’m bald already… After getting over the frustration of trying to solve this problem, I redrew it on a fresh page and looked hard at it for a minute and had an epiphany… The plot point is not INSIDE the circle, or even anywhere closer to the middle of the chart at all, which would have been ideal, BUT it is really close to the unity line already. I mean REALLY close, so close in fact, I bet you could simply run around the unity line clockwise to the center point and just “eat” the misalignment on the horizontal resistance line of such a tiny amount and no one would even notice in the real world. You know what this matching network now looks like? A huge by large inductor is what, just a plain ole gigantic coil… Moving clockwise around the impedance lines (the red ones) indicates adding inductance to solve the problem. This is what all the antenna companies use when you buy a mobile 80 meter whip antenna if you think about it, just a huge load coil and nothing more. If you were to zoom in on this, I am guessing the resistive value when you get to the end of the arc, at the horizontal center line (which is the pure resistance line) would be something like 49.2 ohms or something close to that, literally less than 1.1 : 1 SWR maybe less to be honest.
Armed with this knowledge, I wanted to test this theory. So I now needed a way to make a coil to insert between the feedline and the base of the vertical to see if I had learned anything. Well I had this new scope / meter / signal generator widget and I had a way to make a capacitor, I then remembered a video where I guy showed how to measure inductors and capacitors with only a oscilloscope if you have one known device. Well, I have a capacitor that I made and I can measure it with the new meter, so that will give me the “known”.
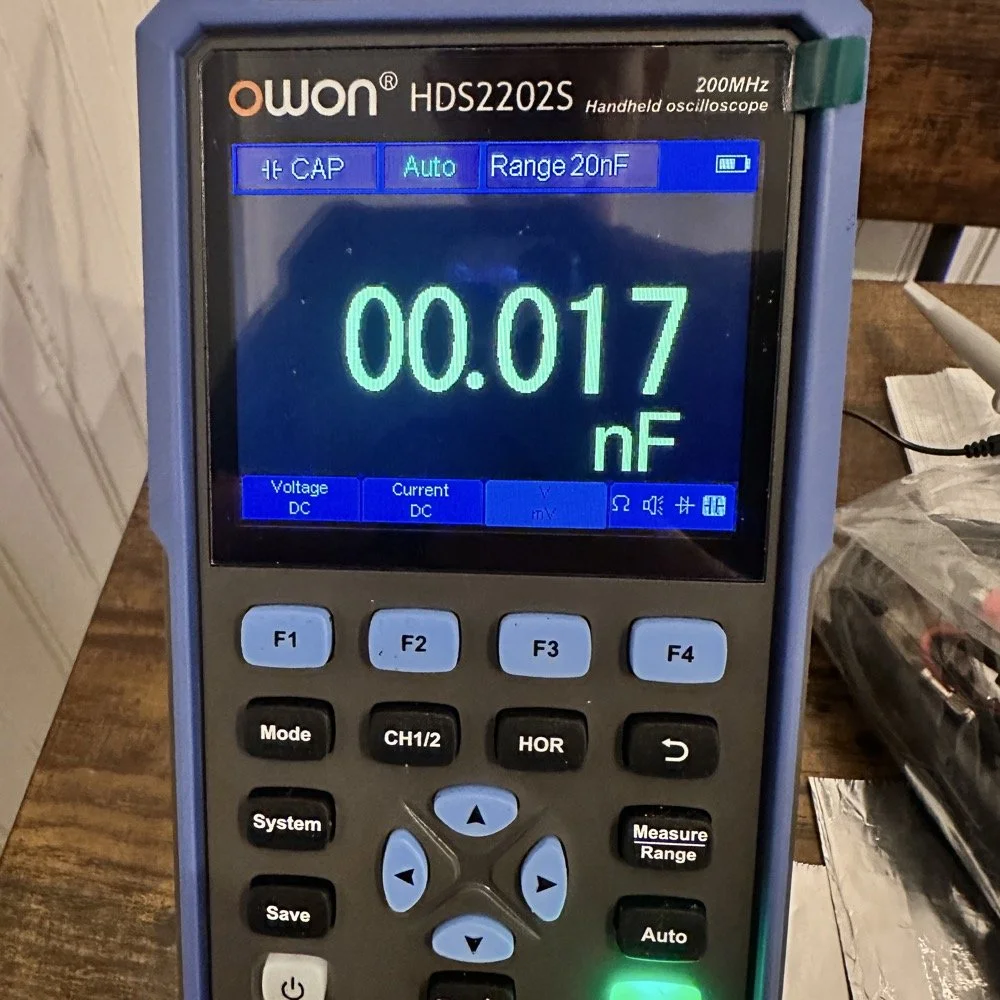
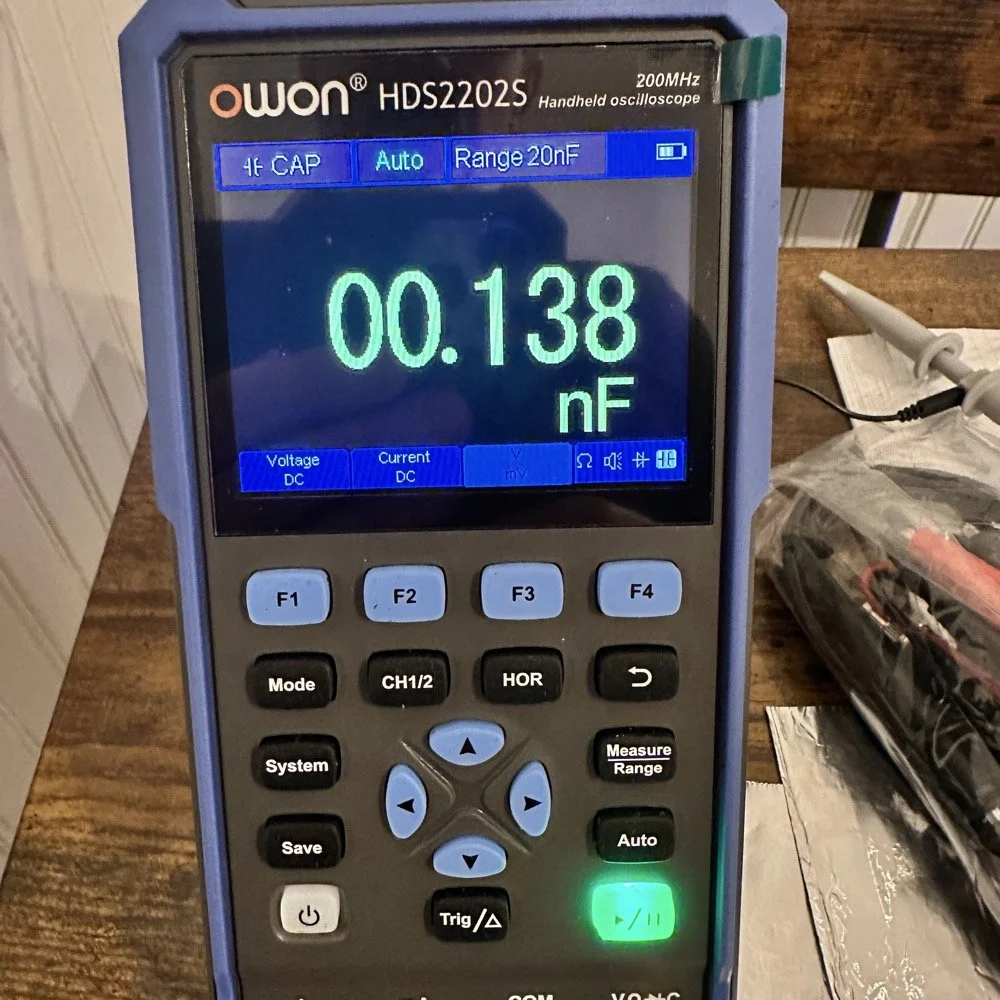
So I fire up the new meter and plug in the leads and find this. There is no way to “tare” out this number either so you simply have to subtract it from what ever you measure. I figured this would be pretty easy so I just went with it. Below is a photo while I was trimming the capacitor to a size I wanted. I was looking for 100pf and as you can see below on the meter, I was getting close. This is measuring right at 121pf in the photo. I would trim off the edge of the sheet and then check it again, rinse and repeat till it was close to what I wanted.
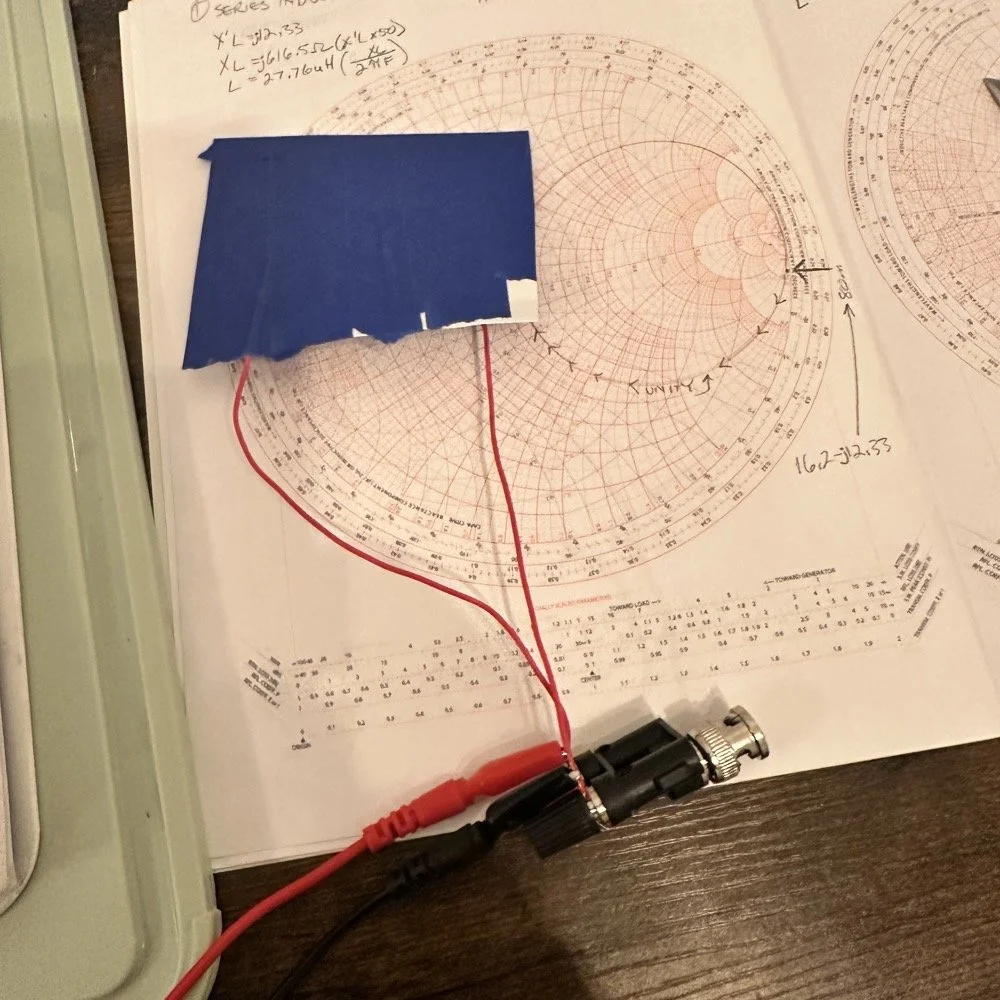
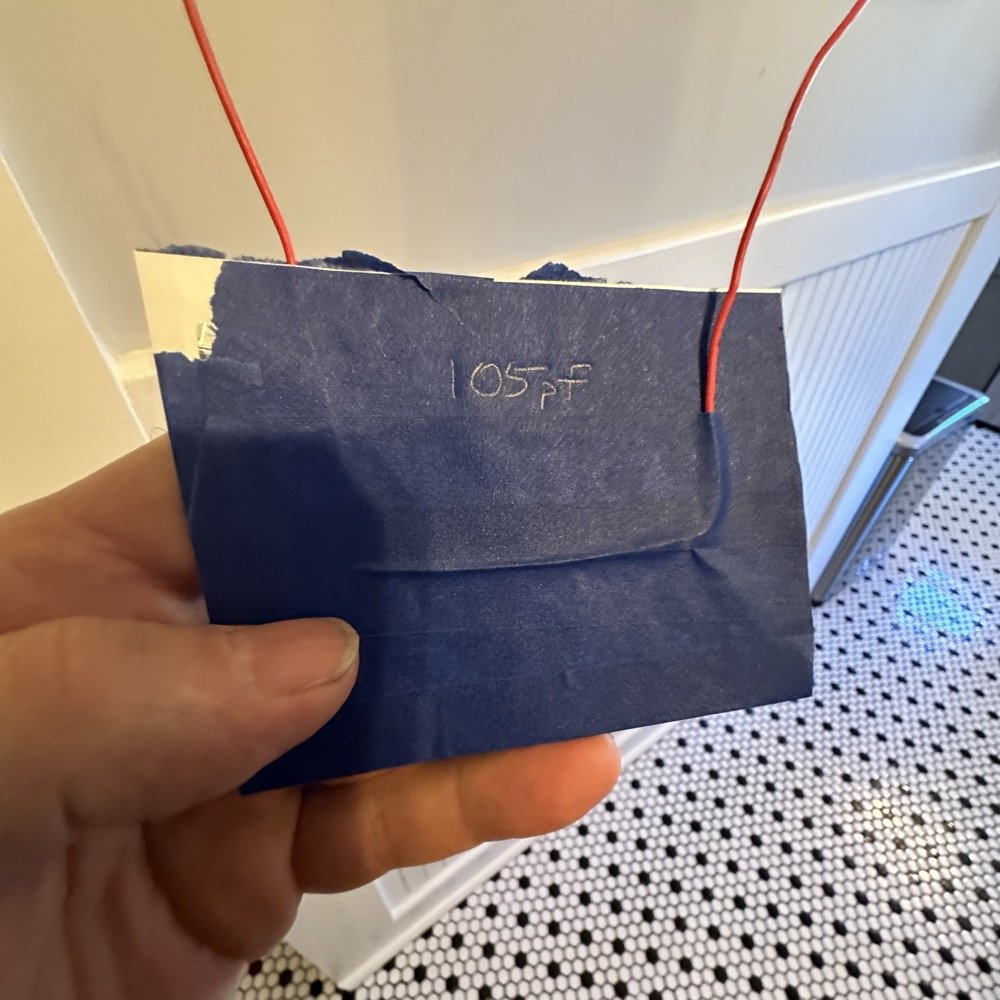
Once I had my brand spanking new capacitor made and trimmed to size (105pf), I setup a test fixture to do my test with. The test fixture is also expedient since it is all that I had was one of those “BNC to binding post” adapters and just used it as a sort of bread board to attach all the parts to the system. It worked, it was pretty janky, but it worked. All that we have here in reality is a parallel tank circuit. It will resonate at one frequency natively and I can measure that and then use a simple online calculator to see what the inductance is based on my capacitor value and the frequency of the tank circuit. How do I get it to resonate then? Simple, use a battery…
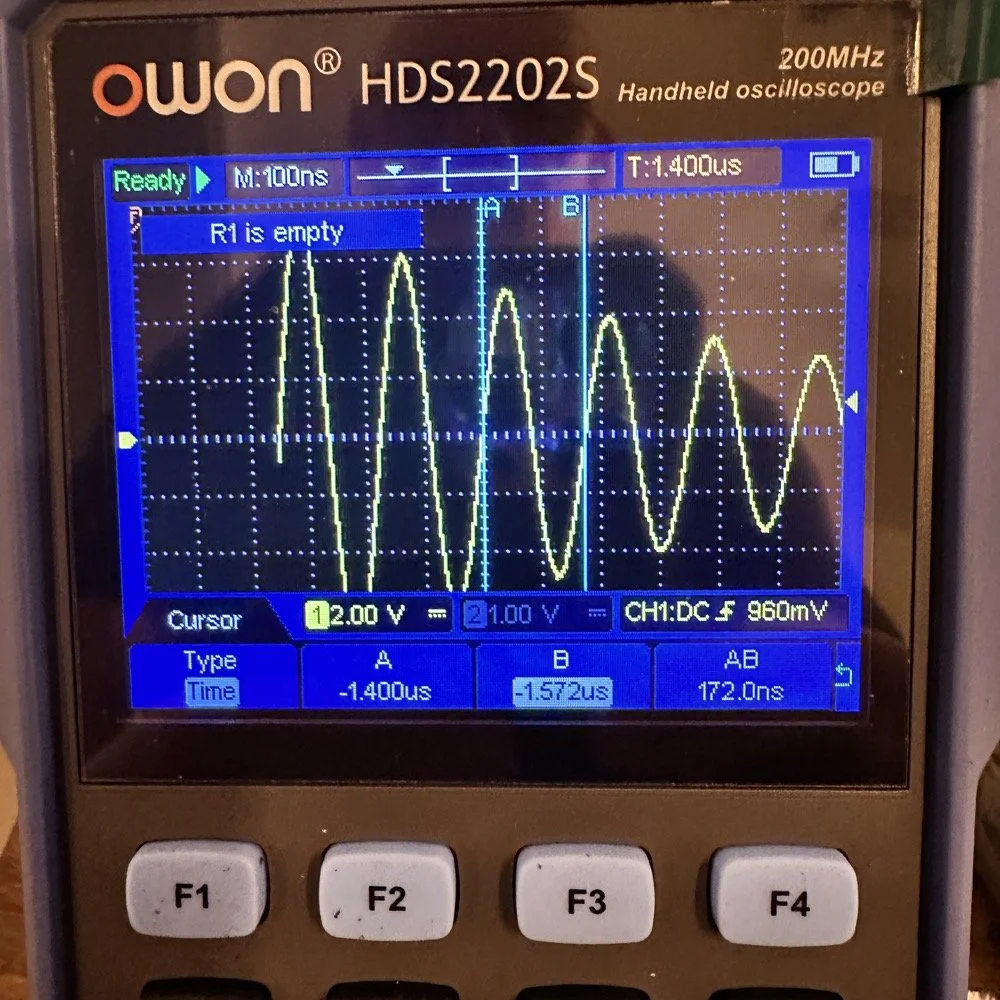
In the other video I had recently watched he showed simply setting the scope to trigger off of a voltage level close to the value of the battery which will allow the scope to capture the ringing of the tank circuit if you pulse it with a battery. I just took a AA out of my pocket flashlight and used it, set the trigger to normal and set the trigger level to about 1 volt and started touching the battery to the two red wires going out to the left in this photo below. This biased the tank circuit (simply applying a dc voltage across the capacitor and charging it) and I was rewarded with what you see below on the scope in the below photo. To be perfectly honest with you, I had done so much wrong in this process that I was honestly surprised that it worked. I even had to show it to Teresa and she had literally zero idea about what she was seeing here, but I had to show SOMEONE that it has actually worked!
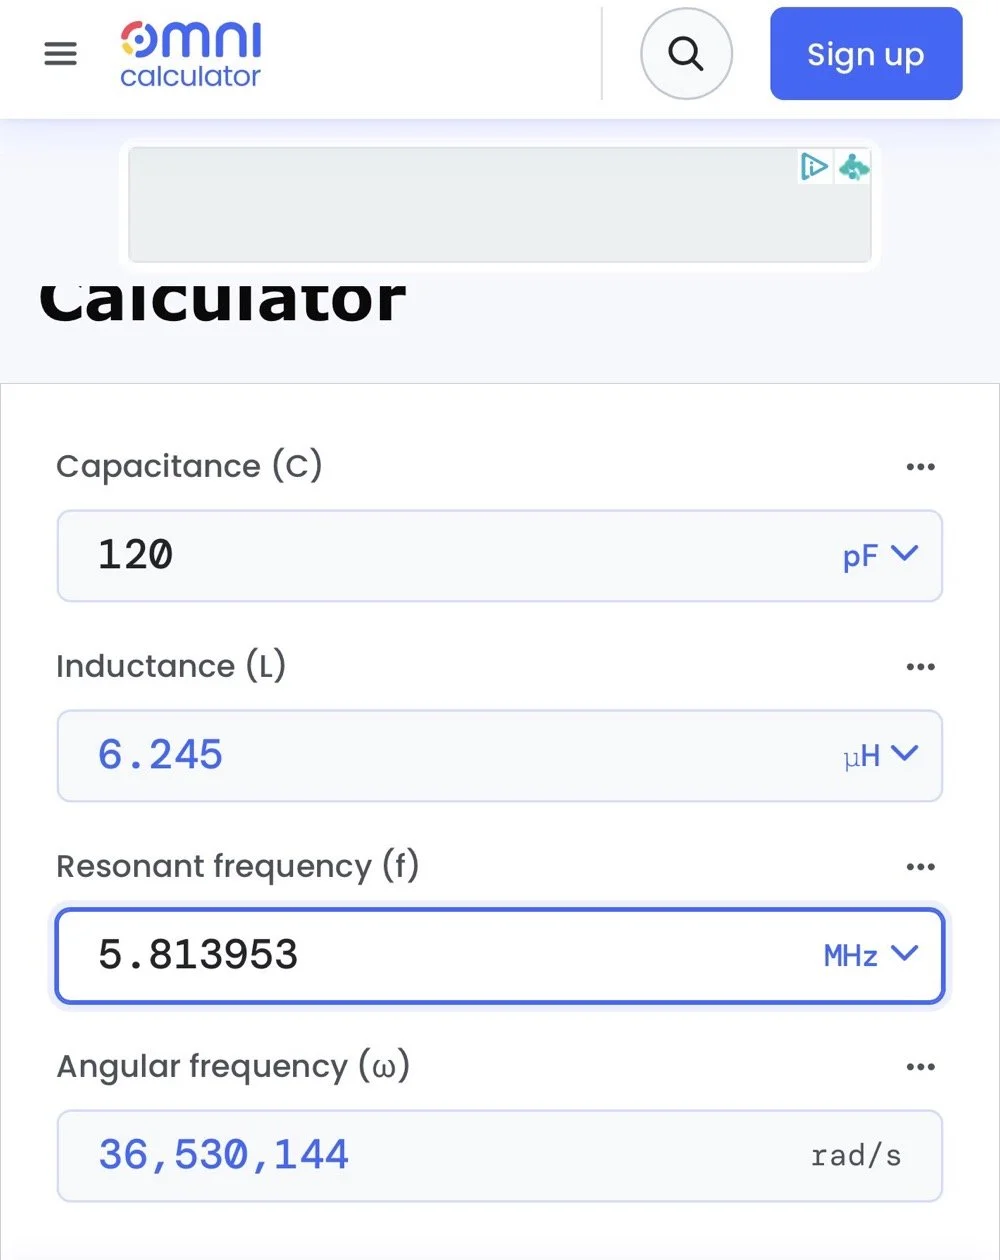
The ringing the scope captured is nice and clean and I was able to measure the period of the sine wave at 172 nanoseconds. Transforming the time into a frequency is easy, you simply invert the number or divide 1 by .000000172 and you get 5,813,953 hz. This frequency is not relevant to the ham bands but is only useful in telling us what the value of the inductor is, which is what we want anyway. As you can see from the screen shot below, this inductor is 6.245 uH (micro henrys). I did the plot on the smith chart for 40 meters for this antenna and came up with almost exactly this number, I came up with 6.62uH on the math. This also makes sense as I did this physical coil for the 213” (17.75’) WRC vertical and not this one that is longer that I am using now 221” (18.4’). Another possible reason for the variation from the measured and the plotted values is that my capacitor value could be slightly different from being moved around or being in proximity to metal or some such. You could touch the capacitor with your finger tip and the value would change so this is probably part of the variation…
I made this actual load coil by guessing to be honest, I did use the nanoVNA as a SWR meter when I made it and I would take off a coil or two and measure it and I simply walked the null in on the antenna for 40 meters that day. Now I know how to use a smith chart to do that math ahead of time. That is pretty cool.
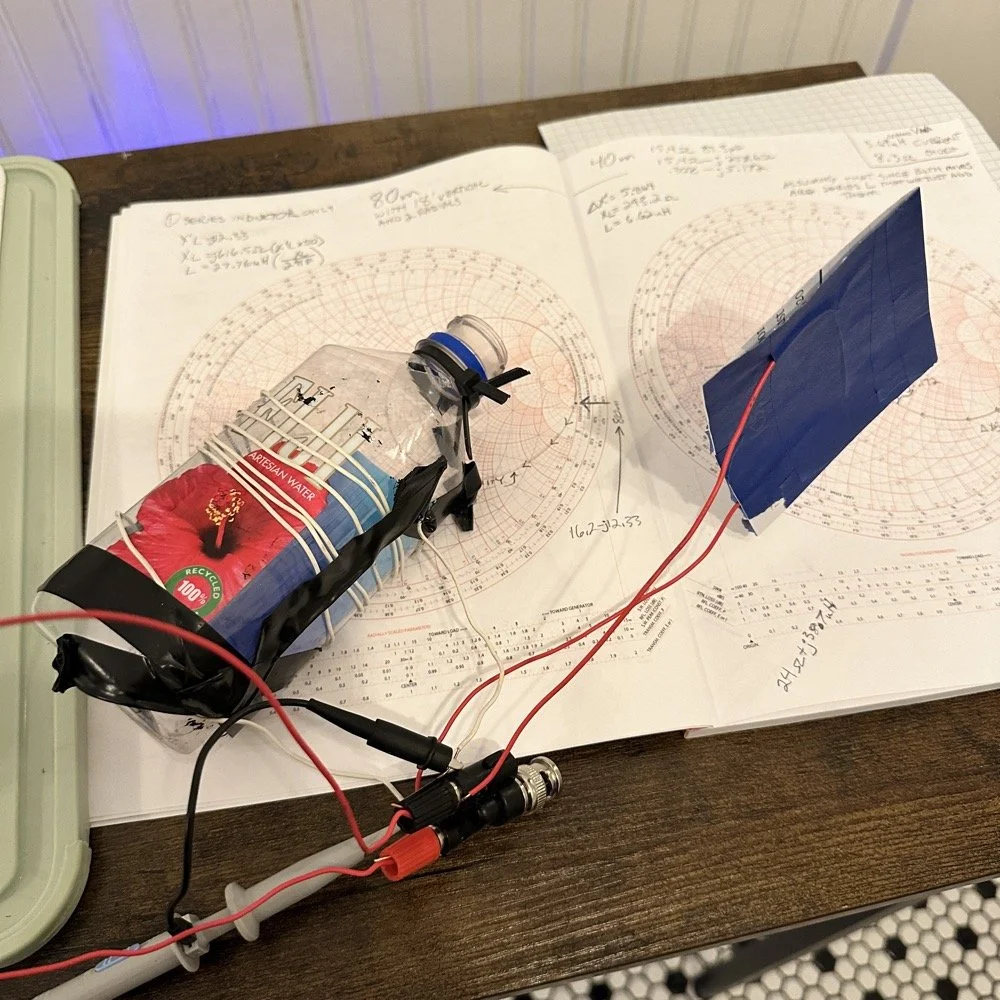
Literally using trash to resonate as a tank circuit is kinda cool to be honest with you. The wires for the capacitor are simply taped to the aluminum foil, nothing more as I didn’t have a way to solder them together or anything like that. This was truly a temporary test fixture for experimentation.
The next logical step was to make an inductor for 60 meters and to hook it up to the antenna and measure it with the nanoVNA to see how close I could get it. This is where things started to go south…
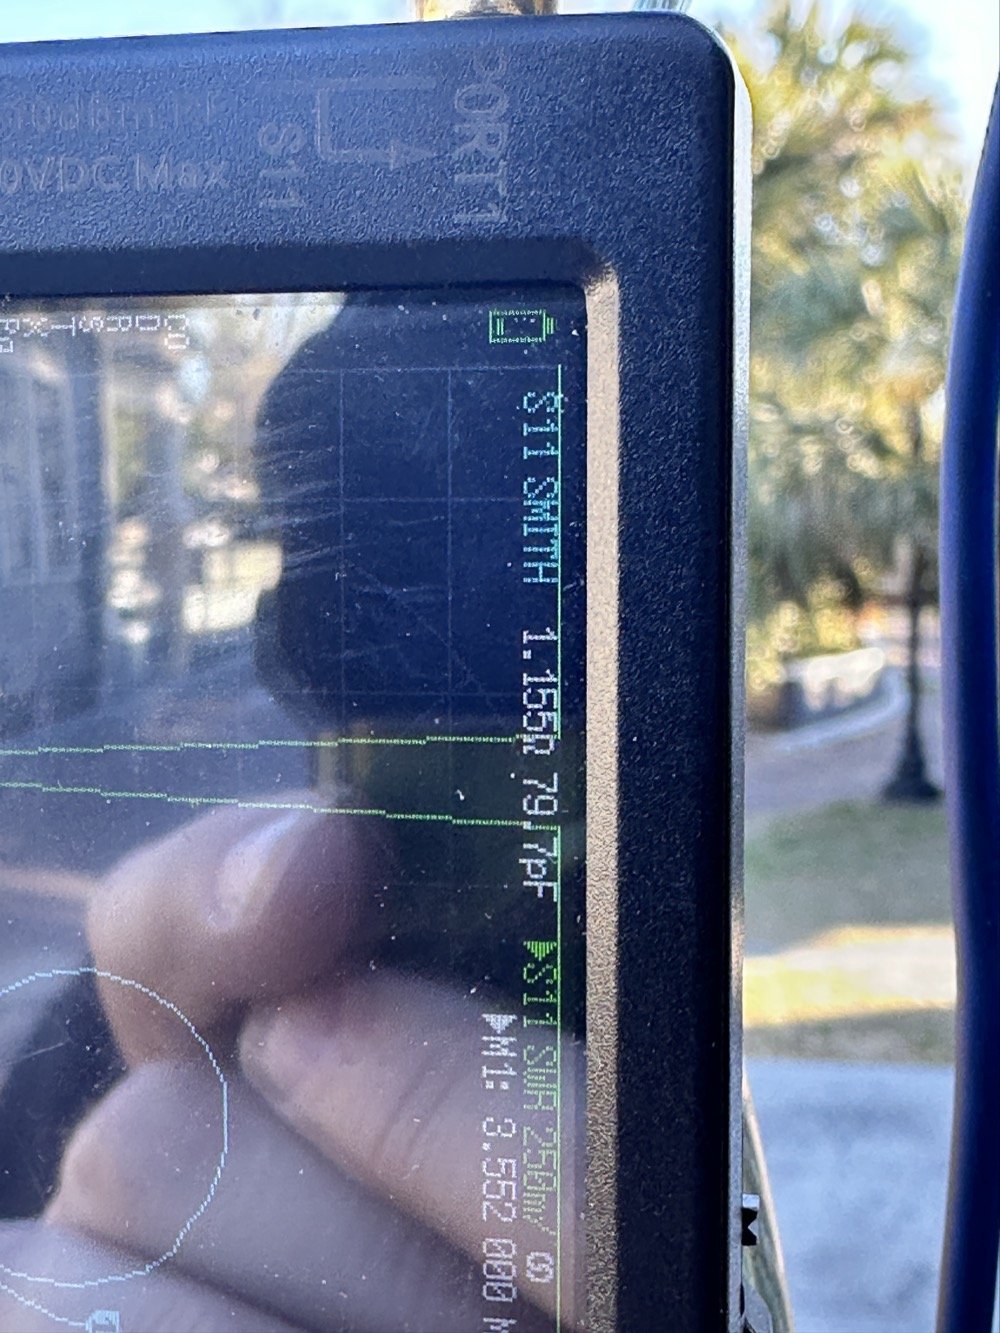
First of all, I had problems replicating the same resistance and capacitance from that day at the POTA park. The photo of the VNA above shows what I am talking about. Now it is 1 ohm… yeah basically a dead short for the RF. But more importantly it is different from the day of my test which was about 10 ohms (if memory serves me) but basically this doesn’t matter when you get to the region of the smith chart that this plot is landing in. The capacitance is what really drives this position between these two numbers and it was virtually the same. The amount of inductance will be more for 1 ohm but not a whole lot more.
Well what happened when I hooked up the coil and the vertical and stuff in the driveway was a whole bunch of nothing! It just made a circle around the outside of the smith chart, which is bad if you don’t know. You want your line to go through the center of the chart at the frequency you want to use and if it goes around the outside it ain’t going through the middle!
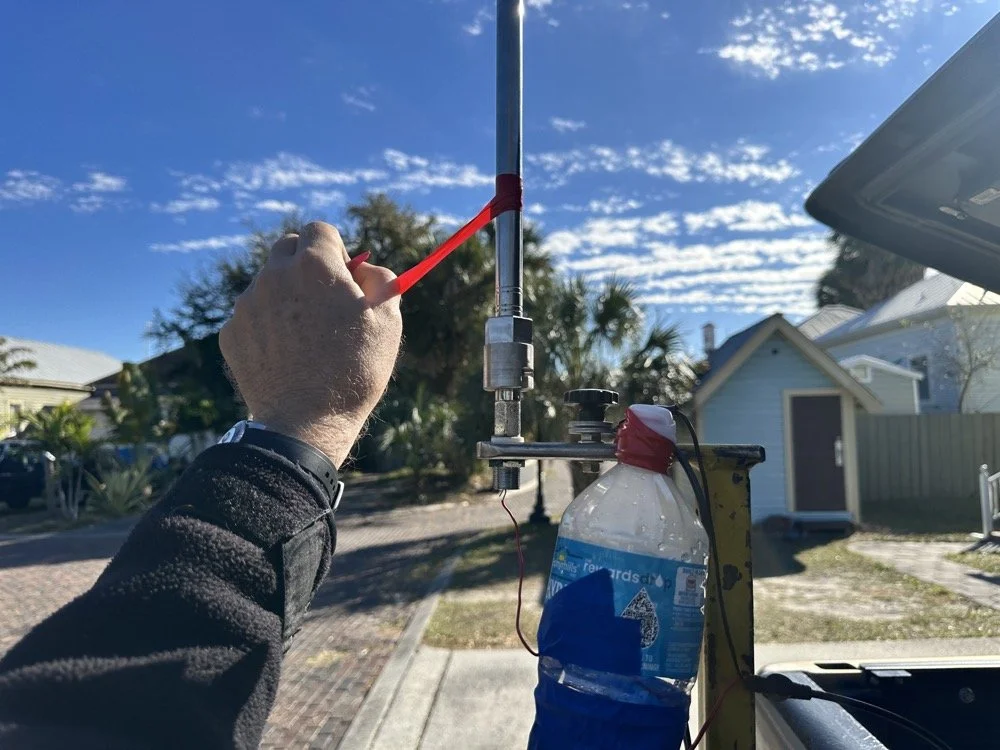
Deflated that I had probably done all that math wrong…again… I was about to throw in the towel when the wind blew and the plot on the nanoVNA moved towards the center! What just happened??? I start messing with this and that, as you can see in the photo above that the coil output wire is just poked into the coax port on the antenna. This has to be the worst way to make this connection, but if this is all you have, then this is what you do…
I could grab the vertical and that would make drastic changes to the smith plot, so I thought about moving the antenna without touching it and I found a roll of electrical tape and used that to tug on the vertical as it is in a QD mount (which is not a great connection to be honest that I have found). I even cleaned some stuff to no avail, but when I put the tape on the antenna and pulled it in certain directions, I would get the plot you see below. Notice the marker is at 5.340 mhz and at 55.2 ohms and just 1.49nf capacitive. This is less than 1.2 : 1 SWR and I am sure that it is off a little because of the system losses at this point. All the loose and dirty connections along with the random radial placement (I find this makes a pretty large difference with my systems) made getting repeatable results almost impossible. This told me that the coil worked though and that my math was not wrong! I had actually learned something here!
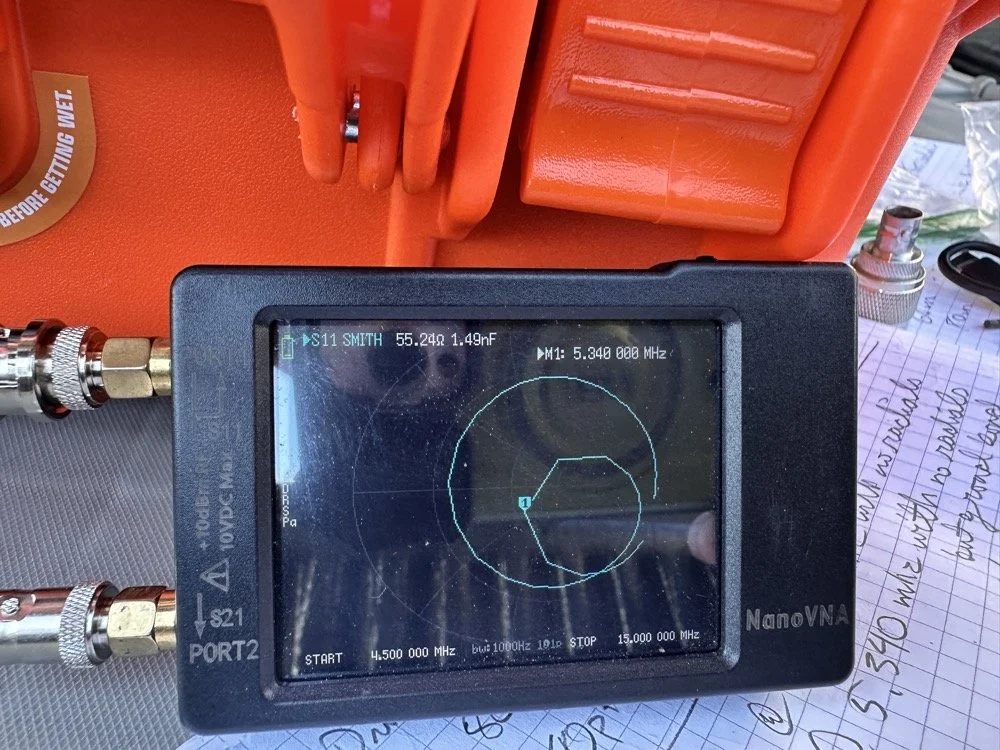
Once I figured this out and took a couple of photos for the blog, I tore the system back down and put it all away so I could get started on this write up about it. This has been an amazing process to do this and I learned way more than just how to do impedance matching with a smith chart. I learned that my system is way too inconsistent to simply make a coil and expect it to work in the system. If I had all the parts hard mounted in place with corrosion inhibiting paste on the connections then I could calculate this coil and it would drop right in. I was blown away by this and cant wait to find another use for my smith chart notebook. I hope this has helped you in some way either by simple entertainment or by learning something about smith charts and antennas, or maybe that there are YouTube videos about how to do this sort of stuff, either way, thank you for reading to here and I hope you come back for more of my ramblings in the future!
You can help support this website by using these Amazon Affiliate Links:
QRP/Portable Radios:
Antennas & Tuning:
CW Equipment:
Power & Accessories:
Organization & Transport:
BONUS ITEMS
73
WK4DS - David